Sara Lee 2010 Annual Report Download - page 90
Download and view the complete annual report
Please find page 90 of the 2010 Sara Lee annual report below. You can navigate through the pages in the report by either clicking on the pages listed below, or by using the keyword search tool below to find specific information within the annual report.-
 1
1 -
2
-
3
-
4
-
5
-
6
-
7
-
8
-
9
-
10
-
11
-
12
-
13
-
14
-
15
-
16
-
17
-
18
-
19
-
20
-
21
-
22
-
23
-
24
-
25
-
26
-
27
-
28
-
29
-
30
-
31
-
32
-
33
-
34
-
35
-
36
-
37
-
38
-
39
-
40
-
41
-
42
-
43
-
44
-
45
-
46
-
47
-
48
-
49
-
50
-
51
-
52
-
53
-
54
-
55
-
56
-
57
-
58
-
59
-
60
-
61
-
62
-
63
-
64
-
65
-
66
-
67
-
68
-
69
-
70
-
71
-
72
-
73
-
74
-
75
-
76
-
77
-
78
-
79
-
 80
80 -
 81
81 -
 82
82 -
 83
83 -
 84
84 -
 85
85 -
 86
86 -
 87
87 -
 88
88 -
 89
89 -
 90
90 -
 91
91 -
 92
92 -
 93
93 -
 94
94 -
 95
95 -
 96
96
 |
 |

Notes to financial statements
88 Sara Lee Corporation and Subsidiaries
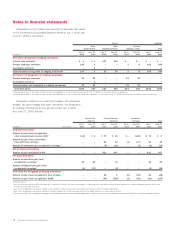
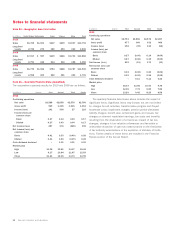
Note 20 – Geographic Area Information
In millions United States Netherlands Spain France Other Total
2010
Sales $6,769 $1,001 $607 $509 $1,907 $10,793
Long-lived
assets 2,725 274 180 294 363 3,836
2009
Sales $7,017 $÷«987 $649 $526 $1,703 $10,882
Long-lived
assets 2,791 345 244 316 386 4,082
2008
Sales $6,774 $1,066 $754 $568 $1,787 $10,949
Long-lived
assets 2,968 400 522 361 450 4,701
Note 21 – Quarterly Financial Data (Unaudited)
The corporation’s quarterly results for 2010 and 2009 are as follows:
In millions Quarter First Second Third Fourth
2010
Continuing operations
Net sales $2,588 $2,858 $2,578 $2,769
Gross profit 969 1,105 1,015 1,012
Income (loss) 191 306 27 118
Income (loss) per
common share
Basic 0.27 0.44 0.04 0.17
Diluted 0.27 0.43 0.04 0.17
Net income (loss) 287 376 (328) 192
Net income (loss) per
common share
Basic 0.41 0.53 (0.49) 0.28
Diluted 0.41 0.53 (0.49) 0.28
Cash dividends declared – 0.11 0.11 0.22
Market price
High 11.36 12.61 14.17 15.08
Low 9.17 10.64 11.67 12.83
Close 11.21 12.45 13.74 13.99
In millions Quarter First Second Third Fourth
2009
Continuing operations
Net sales $2,794 $2,856 $2,575 $2,657
Gross profit 977 969 932 966
Income (loss) 192 (39) 134 (62)
Income (loss) per
common share
Basic 0.27 (0.06) 0.19 (0.09)
Diluted 0.27 (0.06) 0.19 (0.09)
Net income (loss) 232 (11) 170 (11)
Net income (loss) per
common share
Basic 0.33 (0.02) 0.24 (0.02)
Diluted 0.32 (0.02) 0.24 (0.02)
Cash dividends declared – 0.11 0.11 0.22
Market price
High 15.07 13.55 10.64 9.75
Low 12.05 7.74 6.80 7.85
Close 13.29 9.42 8.25 9.58
The quarterly financial data shown above includes the impact of
significant items. Significant items may include, but are not limited
to: charges for exit activities; transformation program and Project
Accelerate costs; impairment charges; pension partial withdrawal
liability charges; benefit plan curtailment gains and losses; tax
charges on deemed repatriated earnings; tax costs and benefits
resulting from the disposition of a business; impact of tax law
changes; changes in tax valuation allowances and favorable or
unfavorable resolution of open tax matters based on the finalization
of tax authority examinations or the expiration of statutes of limita-
tions. Further details of these items are included in the Financial
Review section of the Annual Report.