Sara Lee 2010 Annual Report Download - page 35
Download and view the complete annual report
Please find page 35 of the 2010 Sara Lee annual report below. You can navigate through the pages in the report by either clicking on the pages listed below, or by using the keyword search tool below to find specific information within the annual report.-
 1
1 -
2
-
3
-
4
-
5
-
6
-
7
-
8
-
9
-
10
-
11
-
12
-
13
-
14
-
15
-
16
-
17
-
18
-
19
-
20
-
21
-
22
-
23
-
24
-
 25
25 -
 26
26 -
 27
27 -
 28
28 -
 29
29 -
 30
30 -
 31
31 -
 32
32 -
 33
33 -
 34
34 -
 35
35 -
 36
36 -
 37
37 -
 38
38 -
 39
39 -
 40
40 -
 41
41 -
 42
42 -
 43
43 -
 44
44 -
 45
45 -
46
-
47
-
48
-
49
-
50
-
51
-
52
-
53
-
54
-
55
-
56
-
57
-
58
-
59
-
60
-
61
-
62
-
63
-
64
-
65
-
66
-
67
-
68
-
69
-
70
-
71
-
72
-
73
-
74
-
75
-
76
-
77
-
78
-
79
-
80
-
81
-
82
-
83
-
84
-
85
-
86
-
87
-
88
-
89
-
90
-
91
-
92
-
93
-
94
-
95
-
96
 |
 |

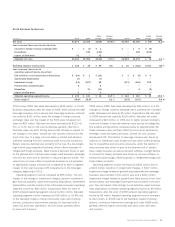
Sara Lee Corporation and Subsidiaries 33
2010 versus 2009
Net sales decreased by $219 million, or 10.5%.
Business dispositions after the start of 2009, which include the DSD
beverage business and a sauces and dressings business, reduced
net sales by $142 million, while the change in foreign currency
exchange rates and the impact of the 53rd week increased net
sales by $35 million. Adjusted net sales decreased by $112 mil-
lion, or 5.7%, due to unit volume declines partially offset by a
favorable sales mix shift. Pricing actions had virtually no impact on
the change in net sales. Overall net unit volumes declined 10.0%
due to the loss of a large non-core bakery contract and demand
softness resulting from the continued weak economic conditions.
Bakery volumes declined due primarily to the loss of a low-margin,
high-volume pizza ingredient business, which offset increases in
refrigerated dough products. Meat volumes declined, driven in part
by the planned exit of certain lower margin meat business. Beverage
volumes are down due to declines in roast and ground coffee. The
recent loss of some coffee concentrate business is not expected
to significantly impact volumes but is expected to have a negative
impact on the year-over-year profit comparisons in the beverage
category beginning in 2011.
Operating segment income increased by $89 million. The net
impact of the change in impairment charges, pension curtailment
gain and exit activities, asset and business dispositions, accelerated
depreciation, and the impact of the 53rd week increased operating
segment income by $82 million. Dispositions after the start of
2009 reduced operating segment income by $11 million. Adjusted
operating segment income increased by $18 million, or 13.9%, due
to the favorable impact of lower commodity costs net of pricing
actions, continuous improvement savings, an improved shift in
sales mix and lower distribution and fuel costs, partially offset
by lower unit volumes.
2009 versus 2008
Net sales decreased by $94 million, or 4.3%.
Changes in foreign currency exchange rates, primarily the Canadian
dollar, decreased net sales by $5 million. Dispositions after the start
of 2008 reduced net sales by $108 million. Adjusted net sales
increased by $19 million, or 0.9% due to higher product pricing to
cover the increase in key raw material costs across all categories.
The positive pricing actions increased sales by approximately 5%.
These increases were partially offset by unit volume declines for
beverage, meat and bakery products. Overall net unit volumes
decreased 4.2%. The decline in beverage volumes was driven by
softness in traditional roast and ground and other coffee products
due to competitive and economic pressures, while the decline in
meat volumes was driven in part by the planned exit of certain
lower margin business as well as demand softness. A slight decline
in volumes for bakery products was driven by volume softness in
foodservice pizza dough offset by growth in refrigerated dough and
frozen bakery products.
Operating segment income increased by $360 million due to
a $324 million reduction in impairment charges. A $107 million
impairment charge related to goodwill associated with the beverage
business was recorded in the current year and a $431 million
impairment charge related to goodwill and fixed assets in the food-
service bakery and beverage businesses was recorded in the prior
year. The net impact of the change in exit activities, asset and busi-
ness dispositions increased operating segment income by $6 million.
Dispositions after the start of 2008 reduced operating segment
income by $2 million. Adjusted operating segment income increased
by $32 million, or 29.0% due to the favorable impact of pricing
actions, continuous improvement savings and lower SG&A costs,
partially offset by higher commodity and labor costs and lower
unit volumes.
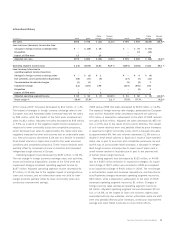
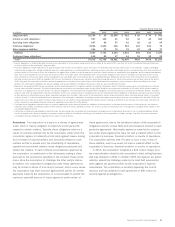
North American Foodservice
Dollar Percent Dollar Percent
In millions 2010 2009 Change Change 2009 2008 Change Change
Net sales $1,873 $2,092 $(219) (10.5) % $2,092 $2,186 $««(94) (4.3) %
Less: Increase/(decrease) in net sales from
Changes in foreign currency exchange rates $÷÷÷«– $÷÷÷(3) $÷÷«3 $«««««««– $«««««««5 $««««(5)
Dispositions – 142 (142) – 108 (108)
Impact of 53rd week 32–32 –––
Adjusted net sales $1,841 $1,953 $(112) (5.7) % $2,092 $2,073 $÷«19 0.9 %
Operating segment income (loss) $÷«125 $÷÷«36 $÷«89 NM $«««««36 $««(324) $«360 NM %
Less: Increase/(decrease) in
operating segment income (loss) from
Exit activities, asset and business dispositions $÷÷(10) $÷÷÷«1 $÷(11) $«««««««1 $««««««(5) $«««««6
Accelerated depreciation (7) – (7) – – –
Impairment charge (15) (107) 92 (107) (431) 324
Pension plan curtailment gain 6–6 –––
Disposition – 11 (11) – 2 (2)
Impact of 53rd week 2–2 –––
Adjusted operating segment income $÷«149 $÷«131 $÷«18 13.9 % $÷«142 $÷«110 $÷«32 29.0 %
Gross margin % 25.6% 25.5% 0.1 % 25.5% 24.9% 0.6 %%