Sara Lee 2010 Annual Report Download - page 20
Download and view the complete annual report
Please find page 20 of the 2010 Sara Lee annual report below. You can navigate through the pages in the report by either clicking on the pages listed below, or by using the keyword search tool below to find specific information within the annual report.-
 1
1 -
2
-
3
-
4
-
5
-
6
-
7
-
8
-
9
-
 10
10 -
 11
11 -
 12
12 -
 13
13 -
 14
14 -
 15
15 -
 16
16 -
 17
17 -
 18
18 -
 19
19 -
 20
20 -
 21
21 -
 22
22 -
 23
23 -
 24
24 -
 25
25 -
 26
26 -
 27
27 -
 28
28 -
 29
29 -
 30
30 -
31
-
32
-
33
-
34
-
35
-
36
-
37
-
38
-
39
-
40
-
41
-
42
-
43
-
44
-
45
-
46
-
47
-
48
-
49
-
50
-
51
-
52
-
53
-
54
-
55
-
56
-
57
-
58
-
59
-
60
-
61
-
62
-
63
-
64
-
65
-
66
-
67
-
68
-
69
-
70
-
71
-
72
-
73
-
74
-
75
-
76
-
77
-
78
-
79
-
80
-
81
-
82
-
83
-
84
-
85
-
86
-
87
-
88
-
89
-
90
-
91
-
92
-
93
-
94
-
95
-
96
 |
 |

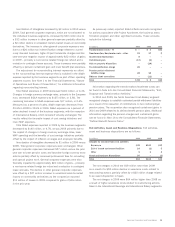
18 Sara Lee Corporation and Subsidiaries
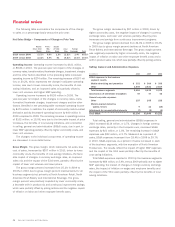
Financial summary
Dollars in millions except per share data Years ended July 3, 2010 1June 27, 2009 June 28, 2008 June 30, 2007 July 1, 2006
Results of Operations
Continuing operations
Net sales $10,793 $10,882 $10,949 $÷9,964 $÷9,371
Operating income 918 487 (51) 305 211
Income before income taxes 795 358 (156) 161 (26)
Income (loss) 642 225 (276) 258 (18)
Income (loss) attributable to Sara Lee 635 220 (280) 256 (18)
Effective tax rate 19.3% 37.3% 76.6% (60.0) % 32.6%
Income (loss) per share of common stock
Basic $÷÷0.92 $÷÷0.31 $«÷(0.39) $÷÷0.35 $÷«(0.02)
Diluted 0.92 0.31 (0.39) 0.34 (0.02)
Income (loss) from discontinued operations (199) 155 236 228 184
Gain (loss) on sale of discontinued operations 84 – (24) 16 401
Net income (loss) 527 380 (64) 502 568
Net income (loss) attributable to Sara Lee 506 364 (79) 504 555
Net income (loss) per share of common stock
Basic 0.74 0.52 (0.11) 0.68 0.72
Diluted 0.73 0.52 (0.11) 0.68 0.72
Financial Position
Total assets $÷8,836 $÷9,419 $10,831 $11,755 $14,660
Total debt 2,781 2,804 3,164 4,204 5,898
Per Common Share
Dividends declared $÷÷0.44 $÷÷0.44 $÷÷0.42 $÷÷0.50 $÷÷0.59
Book value at year-end 2.25 2.93 3.98 3.51 3.22
Market value at year-end 13.99 9.58 12.18 17.40 16.02
Shares used in the determination of net income per share
Basic (in millions) 688 701 715 741 766
Diluted (in millions) 691 703 715 743 768
Other Information – Continuing Operations Only
Net cash flow from operating activities $÷÷«631 $÷÷«640 $÷÷«385 $÷÷«268 $÷«÷122
Net cash from (used in) investing activities (34) (267) (170) 632 744
Net cash from (used in) financing activities (490) (532) (1,601) (749) 757
Depreciation 361 351 367 363 351
Media advertising expense 217 168 187 177 182
Total media advertising and promotion expense 372 309 353 341 338
Capital expenditures 375 359 490 568 396
Common stockholders of record 65,000 67,000 70,000 76,000 82,000
Number of employees 33,000 35,000 37,000 38,000 41,000
153-week year.
Note: The amounts above include the impact of certain significant items. Significant items may include, but are not limited to: exit activities, asset and business dispositions, impairment
charges, transformation charges, Project Accelerate charges, settlement and curtailment gains or losses and various significant tax matters. Further details of these items are included
in the Financial Review on page 22. Operating income is reconciled between the income from each of the corporation’s business segments to income from continuing operations before
income taxes in Note 19 of the Consolidated Financial Statements titled,
Business Segment Information
.
The Consolidated Financial Statements and Notes and the Financial Review should be read in conjunction with the Financial Summary.