Sara Lee 2010 Annual Report Download - page 36
Download and view the complete annual report
Please find page 36 of the 2010 Sara Lee annual report below. You can navigate through the pages in the report by either clicking on the pages listed below, or by using the keyword search tool below to find specific information within the annual report.-
 1
1 -
2
-
3
-
4
-
5
-
6
-
7
-
8
-
9
-
10
-
11
-
12
-
13
-
14
-
15
-
16
-
17
-
18
-
19
-
20
-
21
-
22
-
23
-
24
-
25
-
 26
26 -
 27
27 -
 28
28 -
 29
29 -
 30
30 -
 31
31 -
 32
32 -
 33
33 -
 34
34 -
 35
35 -
 36
36 -
 37
37 -
 38
38 -
 39
39 -
 40
40 -
 41
41 -
 42
42 -
 43
43 -
 44
44 -
 45
45 -
 46
46 -
47
-
48
-
49
-
50
-
51
-
52
-
53
-
54
-
55
-
56
-
57
-
58
-
59
-
60
-
61
-
62
-
63
-
64
-
65
-
66
-
67
-
68
-
69
-
70
-
71
-
72
-
73
-
74
-
75
-
76
-
77
-
78
-
79
-
80
-
81
-
82
-
83
-
84
-
85
-
86
-
87
-
88
-
89
-
90
-
91
-
92
-
93
-
94
-
95
-
96
 |
 |

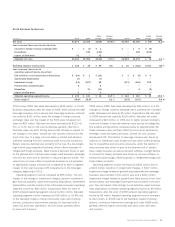
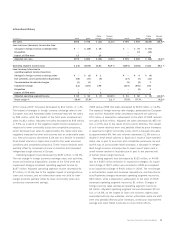
2010 versus 2009
Net sales increased by $159 million, or 5.2%.
The impact of changes in foreign currency exchange rates, particularly
in the European euro and Brazilian real, increased reported net sales by
$124 million, while the 53rd week increased net sales by $48 million.
Acquisitions net of dispositions made after the start of 2009, increased
net sales by $11 million. Adjusted net sales decreased by $24 mil-
lion, or 0.8%, due to lower green coffee export sales, increased trade
promotions and an unfavorable shift in sales mix, partially offset by an
increase in unit volumes. Pricing actions, which included increased trade
promotion activity, reduced net sales by approximately 1%. Unit volumes
increased 1.4% due to volume growth in single serve coffee, traditional
roast and ground and instants, while overall coffee concentrate volumes
were virtually unchanged. Retail volumes in Europe decreased due to
volume declines in traditional roast and ground coffee due in part to
compe titive pressures from private label and hard discounters as well
as weak economic conditions throughout Europe, which was partially
offset by increases in single serve coffee volumes primarily in France
and Germany. The volume declines in Europe were offset by improved
volumes in Brazil. Unit volumes in the foodservice channel in Europe
decreased due to continued weak economic conditions in Europe.
Operating segment income increased by $99 million, or 20.0%.
Changes in foreign currency exchange rates increased operating
segment income by $17 million. The net change in exit activities
asset and business dispositions, transformation/Accelerate charges,
a curtailment gain, a gain on a prior year property sale, the impact
of the 53rd week and acquisitions increased operating segment
income by $33 million. Adjusted operating segment income increased
by $49 million, or 8.8%, due to lower commodity costs including
the impact of hedging gains, the increase in unit volumes, and the
benefits of continuous improvement programs, partially offset by
the negative impact of pricing actions and higher MAP spending.
2009 versus 2008
Net sales decreased by $176 million, or 5.4%.
The impact of foreign currency rate changes, particularly the European
euro, Brazilian real, Australian dollar, and British pound, decreased
reported net sales by $286 million. Acquisitions net of dispositions
after the start of 2008 increased sales by $37 million. Adjusted
net sales increased by $73 million, or 2.5% due to price increases
to offset higher commodity costs, a favorable sales mix shift, and
increased green coffee export sales in Brazil, which were partially
offset by lower unit volumes. Pricing actions represented approximately
2% of the overall increase in net sales. Unit volumes decreased 2.8%
due to declines in the retail channel in both Europe and Brazil. Retail
volumes in Europe decreased due to volume declines in traditional
roast and ground due in part to competitive pressures from private
label and hard discounters as well as the weak economic conditions
throughout Europe, partially offset by growth in single serve coffee
in France and Germany. Unit volumes declined in Brazil due in part to
price increases. Unit volumes in the foodservice channel decreased
slightly due in part to a decline in liquid coffee concentrates.
Operating segment income decreased by $58 million, or 10.5%.
Changes in foreign currency exchange rates decreased operating
segment income by $41 million. The net impact of the change in
exit activities, asset and business dispositions, transformation/
Accelerate charges, and accelerated depreciation decreased operating
segment income by $39 million. Operating results were favorably
impacted by a $12 million curtailment gain related to postretirement
benefit plan changes and a $14 million gain on the disposition of
property. Adjusted operating segment income decreased $6 million,
or 1.0% , due to the impact of higher green coffee costs, the decline
in unit volumes and higher manufacturing costs, partially offset by
pricing actions, a favorable shift in sales mix, and the benefits of
continuous improvement programs.
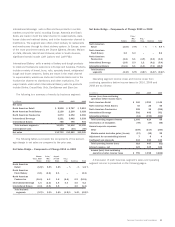
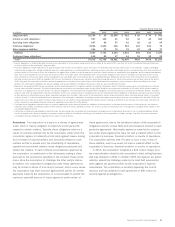
International Beverage
Dollar Percent Dollar Percent
In millions 2010 2009 Change Change 2009 2008 Change Change
Net sales $3,221 $3,062 $159 5.2 % $3,062 $3,238 $(176) (5.4) %
Less: Increase/(decrease) in net sales from
Changes in foreign currency exchange rates $÷÷÷«– $÷(124) $124 $«««««««– $«««286 $(286)
Acquisitions/dispositions 12 1 11 45 8 37
Impact of 53rd week 48–48 –––
Adjusted net sales $3,161 $3,185 $«(24) (0.8) % $3,017 $2,944 $÷«73 2.5 %
Operating segment income $÷«592 $÷«493 $««99 20.0 % $«««493 $«÷551 $««(58) (10.5) %
Less: Increase/(decrease) in
operating segment income from
Changes in foreign currency exchange rates $÷÷÷«– $÷÷(17) $÷17 $«««««««– $«««««41 $««(41)
Exit activities, asset and business dispositions (12) (50) 38 (50) (4) (46)
Transformation/Accelerate charges – (3) 3 (3) (9) 6
Curtailment gain – 12 (12) 12 – 12
Accelerated depreciation – – – – (1) 1
Gain on property disposition – 14 (14) 14 – 14
Acquisitions/dispositions 1–1 2–2
Impact of 53rd week 17–17 –––
Adjusted operating segment income $÷«586 $÷«537 $÷49 8.8 % $÷«518 $÷«524 $÷««(6) (1.0) %
Gross margin % 42.8% 40.1% 2.7 % 40.1% 41.6% (1.5) %
34 Sara Lee Corporation and Subsidiaries
Financial review