Sara Lee 2010 Annual Report Download - page 83
Download and view the complete annual report
Please find page 83 of the 2010 Sara Lee annual report below. You can navigate through the pages in the report by either clicking on the pages listed below, or by using the keyword search tool below to find specific information within the annual report.-
 1
1 -
2
-
3
-
4
-
5
-
6
-
7
-
8
-
9
-
10
-
11
-
12
-
13
-
14
-
15
-
16
-
17
-
18
-
19
-
20
-
21
-
22
-
23
-
24
-
25
-
26
-
27
-
28
-
29
-
30
-
31
-
32
-
33
-
34
-
35
-
36
-
37
-
38
-
39
-
40
-
41
-
42
-
43
-
44
-
45
-
46
-
47
-
48
-
49
-
50
-
51
-
52
-
53
-
54
-
55
-
56
-
57
-
58
-
59
-
60
-
61
-
62
-
63
-
64
-
65
-
66
-
67
-
68
-
69
-
70
-
71
-
72
-
 73
73 -
 74
74 -
 75
75 -
 76
76 -
 77
77 -
 78
78 -
 79
79 -
 80
80 -
 81
81 -
 82
82 -
 83
83 -
 84
84 -
 85
85 -
 86
86 -
 87
87 -
 88
88 -
 89
89 -
 90
90 -
 91
91 -
 92
92 -
 93
93 -
94
-
95
-
96
 |
 |

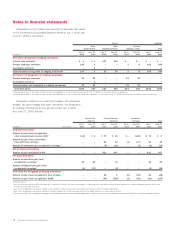
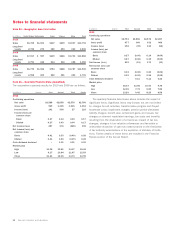
Level 1 assets were valued using market prices based on daily
net asset value (NAV) or prices available through a public stock
exchange. Level 2 assets were valued primarily using market prices,
derived from either an active market quoted price, which may require
adjustments to account for the attributes of the asset, or an inactive
market transaction. The corporation did not have any level 3 assets,
which would include assets for which values are determined by non-
observable inputs. See Note 15 - Financial Instruments for additional
information as to the fair value hierarchy.
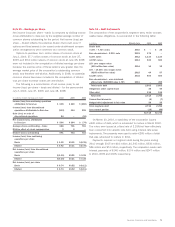
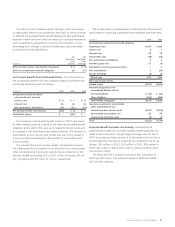
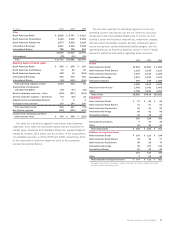
The percentage allocation of pension plan assets based on fair
value as of the respective year-end measurement dates is as follows:
2010 2009
Asset category
Equity securities 16% 24%
Debt securities 74 63
Real estate 33
Cash and other 710
Total 100% 100%
The overall investment objective is to manage the plan assets
so that they are sufficient to meet the plan’s future obligations while
maintaining adequate liquidity to meet current benefit payments and
operating expenses. The actual amount for which these obligations
will be settled depends on future events and actuarial assumptions.
These assumptions include the life expectancy of the plan participants
and salary inflation. The resulting estimated future obligations are
discounted using an interest rate curve that represents a return
that would be required from high quality corporate bonds. The corpo-
ration has adopted a liability driven investment (LDI) strategy and it
is in various stages of implementation of the strategy in each of its
largest pension plans. This strategy consists of investing in a portfolio
of assets whose performance is driven by the performance of the
associated pension liability. This means that plan assets managed
under an LDI strategy may underperform general market returns,
but should provide for lower volatility of funded status as its return
matches the pension liability movement. Over time, as pension
obligations become better funded, the corporation will further
de-risk its investments and increase the allocation to fixed income.
The asset allocation varies by plan and, on an aggregate fair
value basis, it is currently at 74% fixed income securities and 16%
equity securities. On a notional value basis, the plan assets include
investments in equity market futures which effectively moves the
asset allocation to the established targets of 70% fixed income and
21% equity. Fixed income securities can include, but are not limited
to, direct bond investments, pooled or indirect bond investments and
cash. Equity securities can include, but are not limited to, interna-
tional and domestic equities, real estate, commodities and private
equity. Derivative instruments may also be used in concert with either
fixed income or equity investments to achieve desired exposure
or to hedge certain risks. Derivative instruments can include, but
are not limited to, futures, options, swaps or swaptions. The assets
are managed by professional investment firms and performance
is evaluated against specific benchmarks. The responsibility for
the investment strategies typically lies with a committee and the
composition of the committee depends on plan jurisdiction.
Pension assets at the 2010 and 2009 measurement dates do
not include any direct investment in the corporation’s debt or equity
securities. Substantially all pension benefit payments are made
from assets of the pension plans. Using foreign currency exchange
rates as of July 3, 2010 and expected future service, it is anticipated
that the future benefit payments will be as follows: $223 million in
2011, $225 million in 2012, $233 million in 2013, $238 million in
2014, $244 million in 2015 and $1,351 million from 2016 to 2020.
As part of a previously announced capital plan, the corporation
made a voluntary contribution of $200 million into its U.S. defined
benefit pension plans in the fourth quarter of 2010. At the present
time, the corporation expects to contribute approximately $110 million
of cash to its pension plans in 2011. During 2006, the corporation
entered into an agreement with the plan trustee to fully fund certain
U.K. pension obligations by 2015. The anticipated 2011 contribu-
tions reflect the amounts agreed upon with the trustees of these
U.K. plans. Subsequent to 2015, the corporation has agreed to
keep the U.K. plans fully funded in accordance with certain local
funding standards. The exact amount of cash contributions made to
pension plans in any year is dependent upon a number of factors
including minimum funding requirements in the jurisdictions in which
the company operates, the tax deductibility of amounts funded and
arrangements made with the trustees of certain foreign plans.
Defined Contribution Plans The corporation sponsors defined
contribution plans, which cover certain salaried and hourly employees.
The corporation’s cost is determined by the amount of contributions
it makes to these plans. The amounts charged to expense for contribu-
tions made to these defined contribution plans totaled $42 million
in 2010, $43 million in 2009 and $43 million in 2008.
Sara Lee Corporation and Subsidiaries 81