Sara Lee 2010 Annual Report Download - page 28
Download and view the complete annual report
Please find page 28 of the 2010 Sara Lee annual report below. You can navigate through the pages in the report by either clicking on the pages listed below, or by using the keyword search tool below to find specific information within the annual report.-
 1
1 -
2
-
3
-
4
-
5
-
6
-
7
-
8
-
9
-
10
-
11
-
12
-
13
-
14
-
15
-
16
-
17
-
 18
18 -
 19
19 -
 20
20 -
 21
21 -
 22
22 -
 23
23 -
 24
24 -
 25
25 -
 26
26 -
 27
27 -
 28
28 -
 29
29 -
 30
30 -
 31
31 -
 32
32 -
 33
33 -
 34
34 -
 35
35 -
 36
36 -
 37
37 -
 38
38 -
39
-
40
-
41
-
42
-
43
-
44
-
45
-
46
-
47
-
48
-
49
-
50
-
51
-
52
-
53
-
54
-
55
-
56
-
57
-
58
-
59
-
60
-
61
-
62
-
63
-
64
-
65
-
66
-
67
-
68
-
69
-
70
-
71
-
72
-
73
-
74
-
75
-
76
-
77
-
78
-
79
-
80
-
81
-
82
-
83
-
84
-
85
-
86
-
87
-
88
-
89
-
90
-
91
-
92
-
93
-
94
-
95
-
96
 |
 |

Financial review
Income Tax Expense The effective tax rate on continuing operations
in 2010, 2009 and 2008 was impacted by a number of significant
items that are shown in the reconciliation of the corporation’s effec-
tive tax rate to the U.S. statutory rate in Note 18 to the Consolidated
Financial Statements. Additional information regarding income taxes
can be found in “Critical Accounting Estimates” within Management’s
Discussion and Analysis.
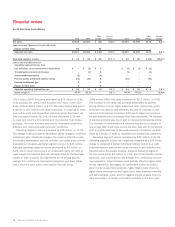
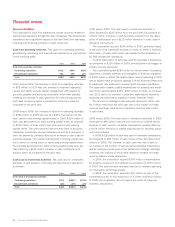
In millions 2010 2009 2008
Continuing operations
Income before income taxes $795 $358 $(156)
Income tax expense (benefit) 153 133 120
Effective tax rates 19.3% 37.3% 76.6%
2010 vs. 2009
In 2010, the corporation recognized tax expense
on continuing operations of $153 million, or an effective tax rate of
19.3%, compared to tax expense of $133 million, or an effective
tax rate of 37.3%, in 2009. The significant components impacting
the change in the corporation’s 2010 effective tax rate are as follows:
•Remittance of Foreign Earnings – The 2010 effective tax rate
was 7 percentage points higher than 2009 primarily due to a tax
charge of $145 million related to current year foreign earnings that
are no longer indefinitely reinvested. Of this total, $121 million was
a charge in connection with the corporation’s third quarter decision
to no longer reinvest overseas earnings primarily attributable to
existing overseas cash and the book value of the household and
body care businesses. The corporation expects to incur charges in
future fiscal years from the remittance of foreign earnings. See the
discussion of
Repatriation of Foreign Earnings and Income Taxes
in
the Liquidity section of Management’s Discussion and Analysis for
more information.
•Finalization of Tax Reviews and Audits and Changes in Estimate
on Tax Contingencies – The 2010 effective tax rate was 16 percent-
age points lower than 2009 due to a $156 million increase in tax
benefits resulting from the resolution of tax audits, the expiration of
statutes of limitations, and changes in estimate on tax contingencies
in various countries and various state and local jurisdictions. Currently,
the corporation believes that it is reasonably possible that the liability
for unrecognized tax benefits will decrease by approximately $0 to
$25 million within the next 12 months from a variety of uncertain
tax positions as a result of the resolution of audits and the expira-
tion of statutes of limitations in several jurisdictions. A majority of
this decrease would impact the corporation’s effective tax rate. For
a summary of open audit years by significant jurisdiction and other
critical estimates surrounding the finalization of tax reviews and
audits, see
Income Taxes
under Critical Accounting Estimates
included in Management’s Discussion and Analysis.
26 Sara Lee Corporation and Subsidiaries
Impairment Charges In 2010, the corporation recognized a
$28 million impairment charge, $15 million of which related to the
writedown of manufacturing equipment associated with the North
American foodservice bakery reporting unit and $13 million of which
related to the writedown of bakery equipment associated with the
Spanish bakery reporting unit.
During 2009, the corporation recognized a $314 million non-cash
charge primarily for the impairment of goodwill and other long-lived
assets associated with the Spanish bakery operations and goodwill
associated with the North American foodservice beverage operations
as both operations were not expected to generate sufficient prof-
itability to support the remaining goodwill balances.
During 2008, the corporation recognized an $851 million non-cash
charge primarily for the impairment of goodwill associated with the
North American foodservice bakery and Spanish bakery operations
and writedowns of certain other assets in North America.
Additional details regarding these impairment charges are
discussed in Note 4 to the Consolidated Financial Statements,
“Impairment Charges.”
Receipt of Contingent Sale Proceeds Under the terms of the sale
agreement for its cut tobacco business sold in 1999, the corporation
was to receive annual cash payments of 95 million euros through
July 2009, contingent on tobacco continuing to be a legal product
in the Netherlands, Germany and Belgium. Tobacco continued to be
a legal product in the required countries through the final payment
date in July 2009. The U.S. dollar amounts received in 2010, 2009
and 2008 upon the expiration of the contingency were $133 million,
$150 million and $130 million, respectively, based upon respective
foreign currency exchange rates on the date of receipt. These
amounts were recognized in the corporation’s earnings when
received and the payments increased diluted earnings per share
from continuing operations in 2010, 2009 and 2008 by $0.19,
$0.21 and $0.18, respectively.
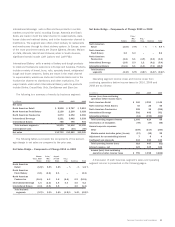
Net Interest Expense Net interest expense decreased by $6 million
in 2010 to $123 million. The decrease in net interest expense was
a result of a $23 million decline in interest expense due to lower
interest rates and average debt levels partially offset by a $17 million
decrease in interest income resulting from a lower rate of return
earned on investments. Net interest expense increased by $24 mil-
lion in 2009 to $129 million. The increase in net interest expense
was a result of a $39 million reduction in interest income resulting
from a decline in cash and cash equivalents, a portion of which was
used to repay debt. This increase was partially offset by a $15 mil-
lion decline in interest expense due to lower average debt levels.