Sara Lee 2010 Annual Report Download - page 39
Download and view the complete annual report
Please find page 39 of the 2010 Sara Lee annual report below. You can navigate through the pages in the report by either clicking on the pages listed below, or by using the keyword search tool below to find specific information within the annual report.-
 1
1 -
2
-
3
-
4
-
5
-
6
-
7
-
8
-
9
-
10
-
11
-
12
-
13
-
14
-
15
-
16
-
17
-
18
-
19
-
20
-
21
-
22
-
23
-
24
-
25
-
26
-
27
-
28
-
 29
29 -
 30
30 -
 31
31 -
 32
32 -
 33
33 -
 34
34 -
 35
35 -
 36
36 -
 37
37 -
 38
38 -
 39
39 -
 40
40 -
 41
41 -
 42
42 -
 43
43 -
 44
44 -
 45
45 -
 46
46 -
 47
47 -
 48
48 -
 49
49 -
50
-
51
-
52
-
53
-
54
-
55
-
56
-
57
-
58
-
59
-
60
-
61
-
62
-
63
-
64
-
65
-
66
-
67
-
68
-
69
-
70
-
71
-
72
-
73
-
74
-
75
-
76
-
77
-
78
-
79
-
80
-
81
-
82
-
83
-
84
-
85
-
86
-
87
-
88
-
89
-
90
-
91
-
92
-
93
-
94
-
95
-
96
 |
 |

Sara Lee Corporation and Subsidiaries 37
2009 versus 2008
The net cash used in financing activities during
2009 was $1,044 million lower than the previous year due primarily
to a $842 million reduction in the net repayment of other debt and
financing less than 90-day maturities as well as a $212 million
reduction in the repurchase of common stock.
The corporation had net repayments of other debt and financings
less than 90-day maturities during 2009 of $363 million as compared
to net repayments of $1,205 million during 2008. The corporation
utilized a combination of cash on hand, short-term borrowings and
new borrowings of long-term debt to repay maturing long-term debt.
The long-term debt maturing during 2009 was repaid using cash on
hand and a new 2-year financing arrangement for €285 million at
Euribor plus 1.75% that was entered into in January 2009.
During 2009, the corporation repurchased 11.4 million shares of
its common stock for $103 million. In 2008, the corporation repur-
chased 19.7 million shares of its common stock for $315 million.
Dividends paid during 2009 were $302 million as compared to
$296 million in 2008.
Liquidity
Notes Payable Notes payable increased from $20 million at
June 27, 2009 to $47 million at July 3, 2010. At the end of 2010,
the corporation had cash and cash equivalents on the balance
sheet of $955 million, which was $4 million higher than the
balance at June 27, 2009.
Anticipated Business Dispositions/Use of Proceeds Sara Lee
made substantial progress toward divesting its International
Household and Body Care businesses in fiscal 2010. The company
announced and closed transactions for the divestiture of the Indian
insecticides business to Godrej for €185 million in the fourth quar-
ter of 2010 and the air care business to Procter & Gamble for
€320 million in early fiscal 2011. The company is also working
on the announced divestiture of the global body care business to
Unilever for €1.275 billion and on the announced divestiture of the
non-Indian insecticides business to SC Johnson for €153.5 million.
Both proposed transactions are expected to close in calendar
year 2010, and are subject to customary closing conditions and
regulatory clearances. Sara Lee is also confident it will be able
to successfully divest the remaining household businesses, prima-
rily its global shoe care and Asian cleaning businesses, based
on interest from various parties. The corporation increased its
net investment hedges in 2010 in order to offset the euro exposure
associated with €1.6 billion of proceeds anticipated to be generated
by the divestiture of its air care and body care businesses.
During 2009, the corporation completed the disposition of its
DSD foodservice operations and received $42 million. It also received
€95 million or $150 million in contingent proceeds from the previous
sale of the corporation’s tobacco product line. The increase versus
the prior year was due to a change in foreign currency exchange
rates. During 2008, the corporation completed the disposition of
its meat operations in Mexico and received $55 million.
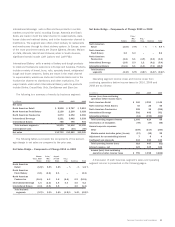
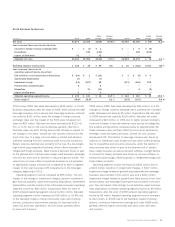
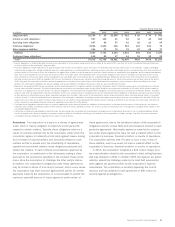
Cash used in Financing Activities The net cash used in financing
activities is split between continuing and discontinued operations
as follows:
2010 2009 2008
Cash used in financing activities
Continuing operations $(490) $(532) $(1,602)
Discontinued operations (311) (235) (209)
Total $(801) $(767) $(1,811)
The cash used in the financing activities of the discontinued
operations primarily represents the net transfers of cash with the
corporate office as most of the cash of these businesses has been
retained as a corporate asset.
2010 versus 2009
The cash used in financing activities in 2010
increased by $34 million over the prior year due primarily to a
$397 million increase in cash used to repurchase shares of the corpo-
ration’s common stock partially offset by a $357 million reduction
in the net repayment of both long-term and short-term debt.
The corporation expended $500 million in 2010 to repurchase
36.4 million shares of its common stock under an accelerated
share repurchase program as part of a new capital structure plan.
During 2009, the corporation repurchased 11.4 million shares of
common stock for $103 million.
In 2010, the corporation had net repayments of other debt and
financings less than 90 days of $6 million, which was a $357 mil-
lion reduction from the $363 million in net repayments in 2009.
The corporation utilized a combination of cash on hand, short-term
borrowings and new borrowings of long-term debt to repay maturing
long-term debt. The long-term debt maturing during 2009 was repaid
using cash on hand and a new 2-year financing arrangement for
€285 million at Euribor plus 1.75% that was entered into in
January 2009.
Dividends paid during 2010 were $308 million as compared to
$302 million in 2009. The annualized dividend rate per share was
$0.44 per share for both years.