Sara Lee 2010 Annual Report Download - page 24
Download and view the complete annual report
Please find page 24 of the 2010 Sara Lee annual report below. You can navigate through the pages in the report by either clicking on the pages listed below, or by using the keyword search tool below to find specific information within the annual report.-
 1
1 -
2
-
3
-
4
-
5
-
6
-
7
-
8
-
9
-
10
-
11
-
12
-
13
-
 14
14 -
 15
15 -
 16
16 -
 17
17 -
 18
18 -
 19
19 -
 20
20 -
 21
21 -
 22
22 -
 23
23 -
 24
24 -
 25
25 -
 26
26 -
 27
27 -
 28
28 -
 29
29 -
 30
30 -
 31
31 -
 32
32 -
 33
33 -
 34
34 -
35
-
36
-
37
-
38
-
39
-
40
-
41
-
42
-
43
-
44
-
45
-
46
-
47
-
48
-
49
-
50
-
51
-
52
-
53
-
54
-
55
-
56
-
57
-
58
-
59
-
60
-
61
-
62
-
63
-
64
-
65
-
66
-
67
-
68
-
69
-
70
-
71
-
72
-
73
-
74
-
75
-
76
-
77
-
78
-
79
-
80
-
81
-
82
-
83
-
84
-
85
-
86
-
87
-
88
-
89
-
90
-
91
-
92
-
93
-
94
-
95
-
96
 |
 |

Financial review
22 Sara Lee Corporation and Subsidiaries
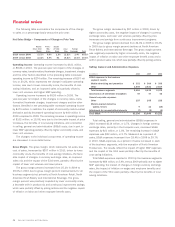
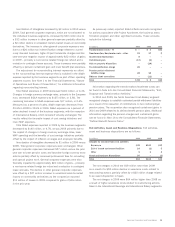
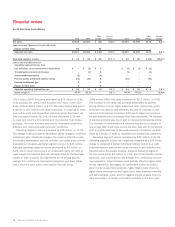
Impact of Significant Items on Income from
Continuing Operations and Net Income
Year ended July 3, 2010 Year ended June 27, 2009 Year ended June 28, 2008
Pretax Diluted EPS Pretax Diluted EPS Pretax Diluted EPS
In millions except per share data Impact Net Income Impact 1Impact Net Income Impact 1Impact Net Income Impact 1
Significant items affecting comparability
of income from continuing operations
and net income
Charges for exit activities $÷(64) $÷(43) $(0.06) $(103) $÷(73) $(0.10) $÷(40) $÷(26) $(0.04)
Income from (charges for) asset and
business disposition activities (20) (14) (0.02) – (4) (0.01) 1 – –
Subtotal (84) (57) (0.08) (103) (77) (0.11) (39) (26) (0.03)
(Charges) income in cost of sales
Accelerated depreciation (8) (5) (0.01) – – – (1) (1) –
Transformation – IT costs – – – – – – (4) (2) –
Curtailment gain 7 5 0.01 6 4 0.01 – – –
Pension partial withdrawal liability charge (1) (1) – (13) (9) (0.01) – – –
(Charges) income in SG&A expenses
Transformation/Accelerate charges – Other (23) (16) (0.02) (17) (11) (0.02) (2) (1) –
Accelerated depreciation (5) (3) – – – – – – –
Transformation – IT costs – – – (4) (3) – (23) (15) (0.02)
Curtailment gain 17 11 0.02 6 4 0.01 – – –
Mexican tax indemnification charge (26) (26) (0.04) – – – – – –
Gain on property disposition – – – 14 10 0.01 – – –
Pension partial withdrawal liability charge (22) (14) (0.02) (18) (11) (0.02) – – –
Balance sheet corrections – – – 11 7 0.01 – – –
Impairment charges (28) (19) (0.03) (314) (289) (0.41) (851) (827) (1.16)
Impact of significant items on income from
continuing operations before income taxes (173) (125) (0.18) (432) (375) (0.53) (920) (872) (1.22)
Significant tax matters affecting comparability
UK net operating loss utilization – 11 0.02 – – – – – –
Tax audit settlements/reserve adjustments – 198 0.29 – 14 0.02 – 77 0.11
Tax on unremitted earnings – (121) (0.18) – – – – – –
Belgian tax proceeding – (44) (0.06) – – – – – –
Tax valuation allowance adjustment – (5) (0.01) – – – – 19 0.03
Tax credit adjustment – 25 0.04 – – – – – –
Deferred tax adjustment on repatriation – 11 0.02 – – – – – –
Provision expense corrections – – – – (19) (0.03) – 15 0.02
Tax benefit on foreign exchange gains – – – – 29 0.04 – – –
Other tax adjustments, net – 12 0.02 – (3) – – – –
Impact on income from continuing operations (173) (38) (0.05) (432) (354) (0.51) (920) (761) (1.06)
Significant items impacting
discontinued operations
Professional fees/other (35) (31) (0.04) (4) (2) – – – –
Curtailment gain/(loss) (10) (8) (0.01) 5 4 – – – –
Competition law charges (28) (28) (0.04) – – – – – –
Transformation/Accelerate charges (17) (14) (0.02) (13) (10) – (7) (5) (0.01)
Tax on unremitted earnings – (428) (0.62) – – – – – –
UK valuation allowance release on NOL’s – 40 0.06 – – – – – –
Capital loss carryforward benefit – 22 0.03 – – – – – –
Deferred tax adjustment on repatriation – 9 0.01 – – – – – –
U.K. Pension plan settlement charge – – – – – – (15) (15) (0.02)
Tax audit settlements/reserve adjustments – – – – – – – 26 0.04
Provision expense corrections – – – – – – (10) (0.01)
Gain (loss) on the sale of discontinued
operations, net 158 84 0.12 – – – (23) (24) (0.03)
Impact of significant items on net income $(105) $(392) $(0.57) $(444) $(362) $(0.51) $(965) $(789) $(1.10)
1The earnings per share (EPS) impact of individual amounts in the table above are rounded to the nearest $0.01 and may not add to the total.