Sara Lee 2010 Annual Report Download - page 82
Download and view the complete annual report
Please find page 82 of the 2010 Sara Lee annual report below. You can navigate through the pages in the report by either clicking on the pages listed below, or by using the keyword search tool below to find specific information within the annual report.-
 1
1 -
2
-
3
-
4
-
5
-
6
-
7
-
8
-
9
-
10
-
11
-
12
-
13
-
14
-
15
-
16
-
17
-
18
-
19
-
20
-
21
-
22
-
23
-
24
-
25
-
26
-
27
-
28
-
29
-
30
-
31
-
32
-
33
-
34
-
35
-
36
-
37
-
38
-
39
-
40
-
41
-
42
-
43
-
44
-
45
-
46
-
47
-
48
-
49
-
50
-
51
-
52
-
53
-
54
-
55
-
56
-
57
-
58
-
59
-
60
-
61
-
62
-
63
-
64
-
65
-
66
-
67
-
68
-
69
-
70
-
71
-
 72
72 -
 73
73 -
 74
74 -
 75
75 -
 76
76 -
 77
77 -
 78
78 -
 79
79 -
 80
80 -
 81
81 -
 82
82 -
 83
83 -
 84
84 -
 85
85 -
 86
86 -
 87
87 -
 88
88 -
 89
89 -
 90
90 -
 91
91 -
 92
92 -
93
-
94
-
95
-
96
 |
 |

Notes to financial statements
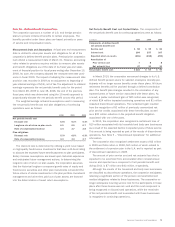
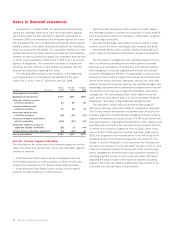
The net periodic benefit cost of the corporation’s defined benefit
pension plans in 2010 was $48 million higher than in 2009. The
increase was primarily due to a $36 million increase in amortization
of net actuarial losses due to net actuarial losses in the prior year,
which increased the amount subject to amortization; as well as the
increase in interest expense and a reduction in expected return on
assets due to the year-over-year change in projected benefit obliga-
tions and asset levels.
The net periodic benefit cost of the corporation’s defined benefit
pension plans in 2009 was $30 million lower than in 2008. The
decline was primarily due to a $23 million reduction in amortization of
net actuarial losses due to net actuarial gains in the prior year, which
reduced the amount subject to amortization; and a $22 million reduc-
tion in service cost due to headcount reductions versus the prior year.
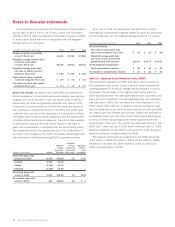
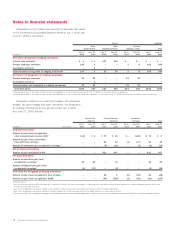
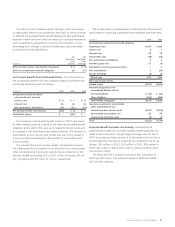
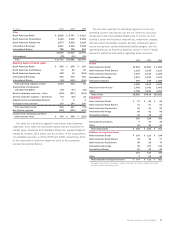
The funded status of defined benefit pension plans at the
respective year-ends was as follows:
In millions 2010 2009
Projected benefit obligation
Beginning of year $4,218 $4,744
Service cost 64 66
Interest cost 264 257
Plan amendments 12
Benefits paid (224) (225)
Elimination of early measurement date –32
Participant contributions 33
Actuarial (gain) loss 761 (179)
Settlement/curtailment (81) (2)
Foreign exchange (279) (480)
End of year 4,727 4,218
Fair value of plan assets
Beginning of year 3,752 4,423
Actual return on plan assets 628 (315)
Employer contributions 332 306
Participant contributions 33
Benefits paid (224) (225)
Settlement (30) (3)
Elimination of early measurement date –22
Foreign exchange (264) (459)
End of year 4,197 3,752
Funded status $÷(530) $÷(466)
Amounts recognized on the
consolidated balance sheets
Noncurrent asset $÷÷÷«7 $÷«133
Accrued liabilities (7) (4)
Pension obligation (530) (595)
Net liability recognized $÷(530) $÷(466)
Amounts recognized in accumulated
other comprehensive income
Unamortized prior service cost $÷÷«55 $÷÷«74
Unamortized actuarial loss, net 1,143 883
Total $1,198 $÷«957
The underfunded status of the plans increased from $466 million
in 2009 to $530 million in 2010, due to a $509 million increase in
the projected benefit obligation which was only partially offset by a
$445 million increase in plan assets. The increase in the projected
benefit obligation was due to actuarial losses resulting from a signif-
icant decrease in the discount rate used to determine the benefit
obligation. The increase in plan assets was the result of a significant
increase in the actual return on plan assets year-over-year due to
improved investment performance during the year.
The accumulated benefit obligation is the present value of pension
benefits (whether vested or unvested) attributed to employee service
rendered before the measurement date and based on employee
service and compensation prior to that date. The accumulated ben -
efit obligation differs from the projected benefit obligation in that
it includes no assumption about future compensation levels. The
accumulated benefit obligations of the corporation’s pension plans
as of the measurement dates in 2010 and 2009 were $4,639 mil-
lion and $4,089 million, respectively.
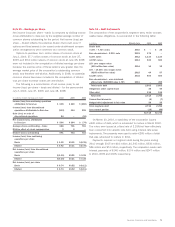
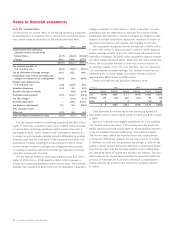
The projected benefit obligation, accumulated benefit obligation
and fair value of plan assets for pension plans with accumulated
benefit obligations in excess of plan assets were:
In millions 2010 2009
Projected benefit obligation $3,230 $2,878
Accumulated benefit obligation 3,203 2,809
Fair value of plan assets 2,705 2,283
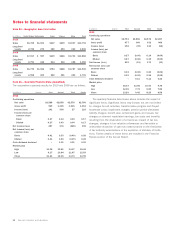
Plan Assets, Expected Benefit Payments and Funding The fair value
of pension plan assets as of July 3, 2010 was determined as follows:
Quoted
Prices in
Active Significant
Market for Other
Identical Observable
Total Fair Assets Inputs
In millions Value (Level 1) (Level 2)
Equity securities
Non-U.S. securities – pooled funds $÷«658 $÷«658 $÷÷–
Fixed income securities
Government bonds 588 588 –
Corporate bonds 715 715 –
U.S. pooled funds 493 493 –
Non-U.S. pooled funds 1,288 737 551
Total fixed income securities 3,084 2,533 551
Real estate 126 126 –
Cash and equivalents 109 109 –
Derivatives 48 73 (25)
Other 172 172 –
Total fair value of assets $4,197 $3,671 $526
80 Sara Lee Corporation and Subsidiaries