Sara Lee 2010 Annual Report Download - page 2
Download and view the complete annual report
Please find page 2 of the 2010 Sara Lee annual report below. You can navigate through the pages in the report by either clicking on the pages listed below, or by using the keyword search tool below to find specific information within the annual report.-
 1
1 -
 2
2 -
 3
3 -
 4
4 -
 5
5 -
 6
6 -
 7
7 -
 8
8 -
 9
9 -
 10
10 -
 11
11 -
 12
12 -
 13
13 -
14
-
15
-
16
-
17
-
18
-
19
-
20
-
21
-
22
-
23
-
24
-
25
-
26
-
27
-
28
-
29
-
30
-
31
-
32
-
33
-
34
-
35
-
36
-
37
-
38
-
39
-
40
-
41
-
42
-
43
-
44
-
45
-
46
-
47
-
48
-
49
-
50
-
51
-
52
-
53
-
54
-
55
-
56
-
57
-
58
-
59
-
60
-
61
-
62
-
63
-
64
-
65
-
66
-
67
-
68
-
69
-
70
-
71
-
72
-
73
-
74
-
75
-
76
-
77
-
78
-
79
-
80
-
81
-
82
-
83
-
84
-
85
-
86
-
87
-
88
-
89
-
90
-
91
-
92
-
93
-
94
-
95
-
96
 |
 |

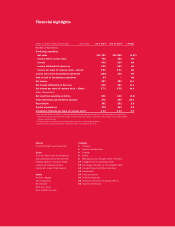
Dollars in millions except per share data Years ended July 3, 2010 1June 27, 2009 1% Change
Results of Operations
Continuing operations
Net sales $10,793 $10,882 (0.8)
Income before income taxes 795 358 NM
Income 642 225 NM
Income attributable to Sara Lee 635 220 NM
Income per share of common stock – diluted 0.92 0.31 NM
Income (loss) from discontinued operations (199) 155 NM
Gain on sale of discontinued operations 84 – NM
Net income 527 380 38.5
Net income attributable to Sara Lee 506 364 39.0
Net income per share of common stock – diluted 0.73 0.52 40.4
Other Information2
Net cash from operating activities 631 640 (1.3)
Total advertising and promotion expense 372 309 20.1
Depreciation 361 351 2.9
Capital expenditures 375 359 4.5
Annualized dividends per share of common stock30.44 0.44 0.0
1See Financial Review and Notes to Financial Statements regarding the exit activities, asset and business dispositions,
impairment charges, transformation charges, Project Accelerate charges and various other charges and credits included
in these reported results.
2Financial amounts include results for businesses reported in continuing operations.
3Represents the dividend declared in the fourth quarter, annualized for the year.
%
Financial highlights
Contents
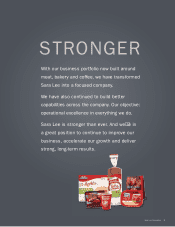
1Stronger
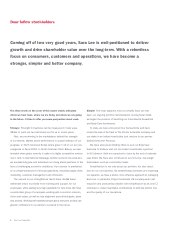
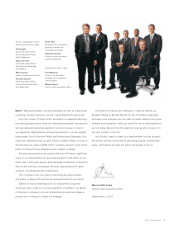
2Letter to stockholders
4Simpler
6Better
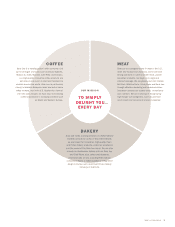
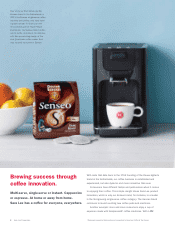
8Brewing success through coffee innovation
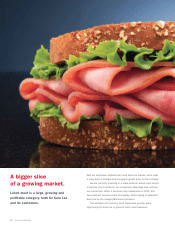
10 A bigger slice of a growing market
12 The power of protein at the breakfast table
14 Accelerating productivity everywhere
16 Sustainable
17 Financial section
91 Performance graph
92 Directors and senior corporate officers
93 Investor information
Mission
To simply delight you… every day
Vision
To be the first choice of consumers
and customers around the world by
bringing together innovative ideas,
continuous improvement and
people who make things happen
Values
Act with
integrity
Use
imagination
Be
inclusive
Work as a
team
Have
passion
to excel