Sara Lee 2010 Annual Report Download - page 57
Download and view the complete annual report
Please find page 57 of the 2010 Sara Lee annual report below. You can navigate through the pages in the report by either clicking on the pages listed below, or by using the keyword search tool below to find specific information within the annual report.-
 1
1 -
2
-
3
-
4
-
5
-
6
-
7
-
8
-
9
-
10
-
11
-
12
-
13
-
14
-
15
-
16
-
17
-
18
-
19
-
20
-
21
-
22
-
23
-
24
-
25
-
26
-
27
-
28
-
29
-
30
-
31
-
32
-
33
-
34
-
35
-
36
-
37
-
38
-
39
-
40
-
41
-
42
-
43
-
44
-
45
-
46
-
 47
47 -
 48
48 -
 49
49 -
 50
50 -
 51
51 -
 52
52 -
 53
53 -
 54
54 -
 55
55 -
 56
56 -
 57
57 -
 58
58 -
 59
59 -
 60
60 -
 61
61 -
 62
62 -
 63
63 -
 64
64 -
 65
65 -
 66
66 -
 67
67 -
68
-
69
-
70
-
71
-
72
-
73
-
74
-
75
-
76
-
77
-
78
-
79
-
80
-
81
-
82
-
83
-
84
-
85
-
86
-
87
-
88
-
89
-
90
-
91
-
92
-
93
-
94
-
95
-
96
 |
 |

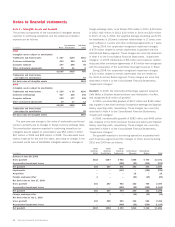
Sara Lee Corporation and Subsidiaries 55
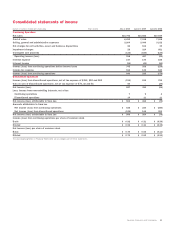
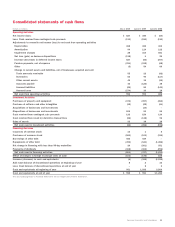
Consolidated statements of cash flows
Dollars in millions July 3, 2010 June 27, 2009 June 28, 2008
Operating Activities
Net income (loss) $÷«527 $÷«380 $«««««(64)
Less: Cash received from contingent sale proceeds (133) (150) (130)
Adjustments to reconcile net income (loss) to net cash from operating activities
Depreciation 368 383 403
Amortization 94 114 122
Impairment charges 28 314 851
Net loss (gain) on business dispositions (138) 1 25
Increase (decrease) in deferred income taxes 527 (83) (267)
Pension payments, net of expense (211) (232) (68)
Other (5) 54 66
Change in current assets and liabilities, net of businesses acquired and sold
Trade accounts receivable 55 23 (92)
Inventories 52 90 (117)
Other current assets 45 16 (36)
Accounts payable 43 (126) 38
Accrued liabilities (26) 83 (143)
Accrued taxes (274) 33 18
Net cash from operating activities 952 900 606
Investment Activities
Purchases of property and equipment (373) (357) (454)
Purchase of software and other intangibles (12) (22) (61)
Acquisitions of businesses and investments – (10) –
Dispositions of businesses and investments 204 53 55
Cash received from contingent sale proceeds 133 150 130
Cash received from (used in) derivative transactions (26) (138) 96
Sales of assets 22 38 38
Net cash used in investment activities (52) (286) (196)
Financing Activities
Issuances of common stock 1315
Purchases of common stock (500) (103) (315)
Borrowings of other debt 466 439 –
Repayments of other debt (492) (541) (1,456)
Net change in financing with less than 90-day maturities 20 (261) 251
Payments of dividends (308) (302) (296)
Net cash used in financing activities (801) (767) (1,811)
Effect of changes in foreign exchange rates on cash (103) (172) 165
Increase (decrease) in cash and equivalents (4) (325) (1,236)
Add: Cash balance of discontinued operations at beginning of year 8216
Less: Cash balance of discontinued operations at end of year –82
Cash and equivalents at beginning of year 951 1,282 2,504
Cash and equivalents at end of year $÷«955 $÷«951 $«1,282
The accompanying Notes to Financial Statements are an integral part of these statements.