Sara Lee 2010 Annual Report Download - page 85
Download and view the complete annual report
Please find page 85 of the 2010 Sara Lee annual report below. You can navigate through the pages in the report by either clicking on the pages listed below, or by using the keyword search tool below to find specific information within the annual report.-
 1
1 -
2
-
3
-
4
-
5
-
6
-
7
-
8
-
9
-
10
-
11
-
12
-
13
-
14
-
15
-
16
-
17
-
18
-
19
-
20
-
21
-
22
-
23
-
24
-
25
-
26
-
27
-
28
-
29
-
30
-
31
-
32
-
33
-
34
-
35
-
36
-
37
-
38
-
39
-
40
-
41
-
42
-
43
-
44
-
45
-
46
-
47
-
48
-
49
-
50
-
51
-
52
-
53
-
54
-
55
-
56
-
57
-
58
-
59
-
60
-
61
-
62
-
63
-
64
-
65
-
66
-
67
-
68
-
69
-
70
-
71
-
72
-
73
-
74
-
 75
75 -
 76
76 -
 77
77 -
 78
78 -
 79
79 -
 80
80 -
 81
81 -
 82
82 -
 83
83 -
 84
84 -
 85
85 -
 86
86 -
 87
87 -
 88
88 -
 89
89 -
 90
90 -
 91
91 -
 92
92 -
 93
93 -
 94
94 -
 95
95 -
96
 |
 |

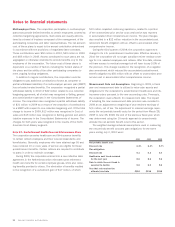
The discount rate is determined by utilizing a yield curve based
on high-quality fixed-income investments that have an AA bond rating
to discount the expected future benefit payments to plan participants.
Assumed health-care trend rates are based on historical experience
and management’s expectations of future cost increases. A one-
percentage-point change in assumed health-care cost trend rates
would have the following effects:
One One
Percentage Percentage
Point Point
In millions Increase Decrease
Effect on total service and interest components $÷2 $÷(2)
Effect on postretirement benefit obligation 20 (17)
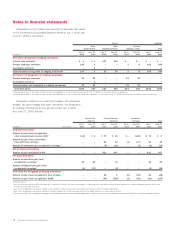
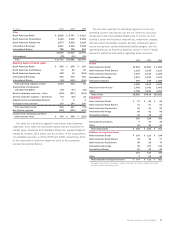
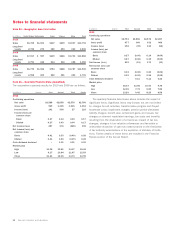
Net Periodic Benefit Cost and Funded Status The components of
the net periodic benefit cost and curtailment gains associated with
continuing operations were as follows:
In millions 2010 2009 2008
Components of defined benefit
net periodic cost (income)
Service cost $÷«5 $÷«7 $÷«8
Interest cost 11 13 16
Net amortization and deferral (29) (23) (18))
Net periodic benefit cost (income) $(13) $÷(3) $÷«6
Curtailment (gains) $÷«– $(12) $÷«–
The increase in net periodic benefit income in 2010 was driven
by lower interest costs as a result of the lower accumulated benefit
obligation at the start of the year as compared to the prior year, and
an increase in net amortization and deferral income. The increase in
amortization of prior service cost credits was due to the impact of
a prior year plan amendment on the amount of unamortized prior
service credits.
The amount of the prior service credits, net actuarial loss and
net initial asset that is expected to be amortized from accumulated
other comprehensive income and reported as a component of net
periodic benefit cost during 2011 is $27 million of income, $3 mil-
lion of expense and $2 million of income, respectively.
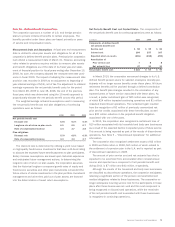
The funded status of postretirement health-care and life-insurance
plans related to continuing operations at the respective year-ends were:
In millions 2010 2009
Accumulated postretirement benefit obligation
Beginning of year $«164 $«252
Service cost 57
Interest cost 11 13
Net benefits paid (18) (21)
Plan participant contributions 23
Actuarial (gain) loss 27 (9)
Elimination of early measurement date –6
Plan amendments 7 (84)
Foreign exchange (1) (3)
End of year 197 164
Fair value of plan assets ––
Funded status $(197) $(164)
Amounts recognized on the
consolidated balance sheets
Accrued liabilities $÷(14) $÷(12)
Other liabilities (183) (152)
Total liability recognized $(197) $(164)
Amounts recognized in accumulated
other comprehensive loss
Unamortized prior service credit $(157) $(197))
Unamortized net actuarial loss 51 25
Unamortized net initial asset (5) (7)
Total $(111) $(179))
Expected Benefit Payments and Funding Substantially all
postretirement health-care and life-insurance benefit payments are
made by the corporation. Using foreign exchange rates at July 3,
2010 and expected future service, it is anticipated that the future
benefit payments that will be funded by the corporation will be as
follows: $14 million in 2011, $14 million in 2012, $14 million in
2013, $14 million in 2014, $14 million in 2015 and $76 million
from 2016 to 2020.
The Medicare Part D subsidy received by the corporation in
2010 was $2 million. The subsidy received in 2009 and 2008
has not been material.
Sara Lee Corporation and Subsidiaries 83