Sara Lee 2010 Annual Report Download - page 31
Download and view the complete annual report
Please find page 31 of the 2010 Sara Lee annual report below. You can navigate through the pages in the report by either clicking on the pages listed below, or by using the keyword search tool below to find specific information within the annual report.-
 1
1 -
2
-
3
-
4
-
5
-
6
-
7
-
8
-
9
-
10
-
11
-
12
-
13
-
14
-
15
-
16
-
17
-
18
-
19
-
20
-
 21
21 -
 22
22 -
 23
23 -
 24
24 -
 25
25 -
 26
26 -
 27
27 -
 28
28 -
 29
29 -
 30
30 -
 31
31 -
 32
32 -
 33
33 -
 34
34 -
 35
35 -
 36
36 -
 37
37 -
 38
38 -
 39
39 -
 40
40 -
 41
41 -
42
-
43
-
44
-
45
-
46
-
47
-
48
-
49
-
50
-
51
-
52
-
53
-
54
-
55
-
56
-
57
-
58
-
59
-
60
-
61
-
62
-
63
-
64
-
65
-
66
-
67
-
68
-
69
-
70
-
71
-
72
-
73
-
74
-
75
-
76
-
77
-
78
-
79
-
80
-
81
-
82
-
83
-
84
-
85
-
86
-
87
-
88
-
89
-
90
-
91
-
92
-
93
-
94
-
95
-
96
 |
 |

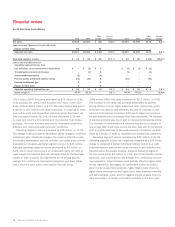
Sara Lee Corporation and Subsidiaries 29
Net Sales Bridge – Components of Change 2009 vs 2008
Price/
Mix/ Acq./
Volume Other Disp. Currency Total
North American
Retail (2.0) % 7.9% – % – % 5.9 %
North American
Fresh Bakery 3.2 5.3 – – 8.5
North American
Foodservice (4.2) 5.1 (4.9) (0.3) (4.3)
International Beverage (2.8) 5.3 1.2 (9.1) (5.4)
International Bakery (11.6) 5.1 (1.3) (7.1) (14.9)
Total business
segments (2.3) % 5.9% (0.8) % (3.4) % (0.6) %
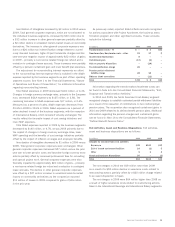
Operating segment income (loss) and income (loss) from
continuing operations before income taxes for 2010, 2009 and
2008 are as follows:
In millions 2010 2009 2008
Income (loss) from continuing
operations before income taxes
North American Retail $÷«346 $«253 $«149
North American Fresh Bakery 44 26 55
North American Foodservice 125 36 (324)
International Beverage 592 493 551
International Bakery (14) (194) (346)
Total operating segment income 1,093 614 85
Amortization of intangibles (49) (47) (48)
General corporate expenses
Other (249) (217) (244)
Mark-to-market derivative gains/(losses) (17) (18) 22
Adjustment for noncontrolling interest 754
Contingent sale proceeds 133 150 130
Total operating income (loss) 918 487 (51)
Interest expense, net 123 129 105
Income (loss) from continuing
operations before income taxes $÷«795 $«358 $(156)
A discussion of each business segment’s sales and operating
segment income is presented on the following pages.
International Beverage
sells coffee and tea products in certain
markets around the world, including Europe, Australia and Brazil.
Sales are made in both the retail channel to supermarkets, ware-
house clubs and national chains, and in the foodservice channel to
distributors. The segment also offers direct delivery to restaurants
and warehouses through its direct delivery system. In Europe, some
of the more prominent brands are
Douwe Egberts, Senseo, Maison
du Café, Marcilla, Merrild
and
Pickwick
, while in South America,
significant brands include
Café Caboclo
and
Café Pilão
.
International Bakery
sells a variety of bakery and dough products
to retail and foodservice customers in Europe and Australia. Products
include a variety of bread, buns, rolls, specialty bread, refrigerated
dough and frozen desserts. Sales are made in the retail channel
to supermarkets, warehouse clubs and national chains and in the
foodservice channel to distributors and other institutions. The
major brands under which International Bakery sells its products
include
Bimbo, CroustiPate, Ortiz, BonGateaux and Sara Lee
.
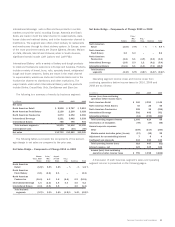
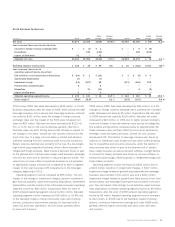
The following is a summary of results by business segment:
In millions 2010 2009 2008
Net sales
North American Retail $÷2,818 $÷2,767 $÷2,613
North American Fresh Bakery 2,128 2,200 2,028
North American Foodservice 1,873 2,092 2,186
International Beverage 3,221 3,062 3,238
International Bakery 785 795 934
Total business segments 10,825 10,916 10,999
Intersegment sales (32) (34) (50)
Net sales $10,793 $10,882 $10,949
The following tables summarize the components of the percent-
age change in net sales as compared to the prior year.
Net Sales Bridge – Components of Change 2010 vs 2009
Volume Price/ Impact
(Excl. 53rd Mix/ of 53rd Acq./
Week) Other Week Disp. Currency Total
North American
Retail (5.5) % 5.5% 1.8% – % –% 1.8 %
North American
Fresh Bakery (3.1) (2.6) 2.4 – – (3.3)
North American
Foodservice (10.0) 4.3 1.6 (6.6) 0.2 (10.5)
International Beverage 1.4 (2.2) 1.6 0.4 4.0 5.2
International Bakery (2.3) (3.5) 1.5 – 3.0 (1.3)
Total business
segments (3.7) % 0.9% 1.8% (1.2) % 1.4% (0.8) %