Sara Lee 2010 Annual Report Download - page 37
Download and view the complete annual report
Please find page 37 of the 2010 Sara Lee annual report below. You can navigate through the pages in the report by either clicking on the pages listed below, or by using the keyword search tool below to find specific information within the annual report.-
 1
1 -
2
-
3
-
4
-
5
-
6
-
7
-
8
-
9
-
10
-
11
-
12
-
13
-
14
-
15
-
16
-
17
-
18
-
19
-
20
-
21
-
22
-
23
-
24
-
25
-
26
-
 27
27 -
 28
28 -
 29
29 -
 30
30 -
 31
31 -
 32
32 -
 33
33 -
 34
34 -
 35
35 -
 36
36 -
 37
37 -
 38
38 -
 39
39 -
 40
40 -
 41
41 -
 42
42 -
 43
43 -
 44
44 -
 45
45 -
 46
46 -
 47
47 -
48
-
49
-
50
-
51
-
52
-
53
-
54
-
55
-
56
-
57
-
58
-
59
-
60
-
61
-
62
-
63
-
64
-
65
-
66
-
67
-
68
-
69
-
70
-
71
-
72
-
73
-
74
-
75
-
76
-
77
-
78
-
79
-
80
-
81
-
82
-
83
-
84
-
85
-
86
-
87
-
88
-
89
-
90
-
91
-
92
-
93
-
94
-
95
-
96
 |
 |

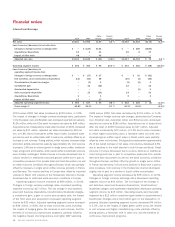
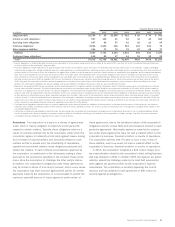
2010 versus 2009
Net sales decreased by $10 million, or 1.3%.
The impact of changes in foreign currency exchange rates in the
European euro and Australian dollar increased reported net sales
by $25 million, while the impact of the 53rd week increased net
sales by $13 million. Adjusted net sales decreased by $48 million,
or 5.8%, as a result of the negative impact of price reductions in
response to lower commodity costs and competitive pressures,
which decreased net sales by approximately 4%. Sales were also
negatively impacted by lower unit volumes and an unfavorable sales
mix. Net unit volumes decreased 2.3% due to a decline in branded
fresh bread volumes in Spain due in part to the weak economic
conditions and competitive pressures. These volume declines were
partially offset by increased volumes in Australia and increased
refrigerated dough volumes in Europe.
Operating segment loss decreased by $180 million, or 92.9%.
The net change in foreign currency exchange rates, exit activities,
asset and business dispositions, impact of the 53rd week and
impairment charges increased operating segment income by
$187 million. Adjusted operating segment income decreased by
$7 million, or 13.0%, due to the negative impact of pricing actions,
lower unit volumes, and an unfavorable sales mix shift to lower
margin products partially offset by lower commodity costs and
continuous improvement savings.
Sara Lee Corporation and Subsidiaries 35
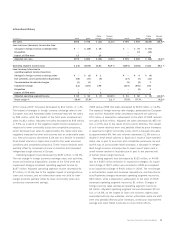
2009 versus 2008
Net sales decreased by $139 million, or 14.9%.
The impact of foreign currency rate changes, particularly the European
euro and the Australian dollar, decreased reported net sales by
$70 million. A disposition subsequent to the start of 2008 reduced
net sales by $14 million. Adjusted net sales decreased by $55 mil-
lion, or 6.5%, due to the result of unit volume declines. The impact
of unit volume declines were only partially offset by price increases
in response to higher commodity costs, which increased net sales
by approximately 6%. Net unit volumes decreased 11.6% due to a
decline in fresh bread volumes in Spain as a result of lower branded
sales, due in part to economic and competitive pressures, as well
as the loss of some private label contracts; a decrease in refriger-
ated dough volumes in Europe due to lower export sales; and a
small volume decline in Australia due in part to the planned exit
of certain lower margin business.
Operating segment loss decreased by $152 million, or 44.0%
due to a $193 million reduction in impairment charges. An impair-
ment charge of $207 million was recorded in 2009 as compared
to an impairment charge of $400 million in 2008. The net change
in exit activities, asset and business dispositions, and transforma-
tion/Accelerate charges decreased operating segment income by
$29 million, while a disposition subsequent to the start of 2008
increased operating segment income by $1 million. Changes in
foreign currency rates decreased operating segment income by
$4 million. Adjusted operating segment income decreased $9 mil-
lion, or 14.9%, as the impact of lower unit volumes, higher costs
associated with key raw materials, and an unfavorable sales mix shift
were only partially offset by price increases, continuous improvement
savings and lower SG&A costs due to cost control efforts.
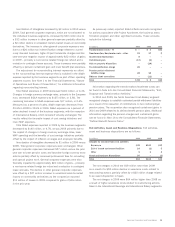
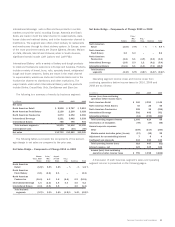
International Bakery
Dollar Percent Dollar Percent
In millions 2010 2009 Change Change 2009 2008 Change Change
Net sales $785 $«795 $«(10) (1.3) % $«795 $«934 $(139) (14.9) %
Less: increase/(decrease) in net sales from
Changes in foreign currency exchange rates $÷÷– $÷(25) $÷25 $÷÷«– $«««70 $««(70)
Disposition – – – – 14 (14)
Impact of 53rd week 13–13 –––
Adjusted net sales $772 $«820 $«(48) (5.8) % $«795 $«850 $««(55) (6.5) %
Operating segment income (loss) $«(14) $(194) $180 92.9 % $(194) $(346) $«152 44.0 %
Less: Increase/(decrease) in
operating segment income (loss) from
Changes in foreign currency exchange rates $÷÷– $÷÷(1) $÷÷1 $÷÷«– $«««««4 $««««(4)
Exit activities, asset and business dispositions (46) (37) (9) (37) (7) (30)
Transformation/Accelerate charges (1) (1) – (1) (2) 1
Impairment charge (13) (207) 194 (207) (400) 193
Disposition – – – «– (1) 1
Impact of 53rd week 1–1 –––
Adjusted operating segment income $««45 $÷«52 $«÷(7) (13.0) % $÷«51 $÷«60 $÷««(9) (14.9) %
Gross margin % 38.6% 37.5% 1.1 % 37.5% 37.7% (0.2) %