Sara Lee 2010 Annual Report Download - page 56
Download and view the complete annual report
Please find page 56 of the 2010 Sara Lee annual report below. You can navigate through the pages in the report by either clicking on the pages listed below, or by using the keyword search tool below to find specific information within the annual report.-
 1
1 -
2
-
3
-
4
-
5
-
6
-
7
-
8
-
9
-
10
-
11
-
12
-
13
-
14
-
15
-
16
-
17
-
18
-
19
-
20
-
21
-
22
-
23
-
24
-
25
-
26
-
27
-
28
-
29
-
30
-
31
-
32
-
33
-
34
-
35
-
36
-
37
-
38
-
39
-
40
-
41
-
42
-
43
-
44
-
45
-
 46
46 -
 47
47 -
 48
48 -
 49
49 -
 50
50 -
 51
51 -
 52
52 -
 53
53 -
 54
54 -
 55
55 -
 56
56 -
 57
57 -
 58
58 -
 59
59 -
 60
60 -
 61
61 -
 62
62 -
 63
63 -
 64
64 -
 65
65 -
 66
66 -
67
-
68
-
69
-
70
-
71
-
72
-
73
-
74
-
75
-
76
-
77
-
78
-
79
-
80
-
81
-
82
-
83
-
84
-
85
-
86
-
87
-
88
-
89
-
90
-
91
-
92
-
93
-
94
-
95
-
96
 |
 |

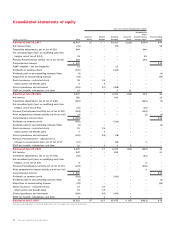
Consolidated statements of equity
54 Sara Lee Corporation and Subsidiaries
Sara Lee Common Stockholders’ Equity
Accumulated
Other
Common Capital Retained Unearned Comprehensive Noncontrolling
Dollars in millions Total Stock Surplus Earnings Stock Income (Loss) Interest
Balances at June 30, 2007 $2,607 $7 $÷«– $3,413 $(123) $(754) $«64
Net income (loss) (64) – – (79) – – 15
Translation adjustments, net of tax of $14 686––––686 –
Net unrealized gain (loss) on qualifying cash flow
hedges, net of tax of $(14) 25–––– 25 –
Pension/Postretirement activity, net of tax of $(4) 192––––192 –
Comprehensive income $÷«839 $«15
GAAP adoption – tax contingencies 13 – – 13 – – –
Dividends on common stock (300) – – (300) – – –
Dividends paid on noncontrolling interest/Other (9)–––– – (9)
Disposition of noncontrolling interest (44) –––– – (44)
Stock issuances – restricted stock 25–25––––
Stock option and benefit plans 9–9–– – –
Share repurchases and retirement (315) – (27) (288) – – –
ESOP tax benefit, redemptions and other 12––111 – –
Balances at June 28, 2008 2,837 7 7 2,760 (112) 149 26
Net income 380 – – 364 – – 16
Translation adjustments, net of tax of $(31) (563) ––––(561) (2)
Net unrealized gain (loss) on qualifying cash flow
hedges, net of tax of $16 (30) –––– (30) –
Pension/Postretirement activity, net of tax of $93 (164) ––––(164) –
Other comprehensive income activity, net of tax of nil (4)–––– (2) (2)
Comprehensive income (loss) $÷(381) $«12
Dividends on common stock (310) – – (310) – – –
Dividends paid on noncontrolling interest/Other (4)–––– – (4)
Stock issuances – restricted stock 29–29––––
Stock option and benefit plans 4–4–– – –
Share repurchases and retirement (103) – (25) (78) – – –
Pension/Postretirement – adjustment to
change in measurement date, net of tax of $7 (13) – – (16) – 3 –
ESOP tax benefit, redemptions and other 11–218 – –
Balances at June 27, 2009 2,070 7 17 2,721 (104) (605) 34
Net income 527 – – 506 – – 21
Translation adjustments, net of tax of $(71) (82) –––– (82) –
Net unrealized gain (loss) on qualifying cash flow
hedges, net of tax of $(4) 8–––– 8 –
Pension/Postretirement activity, net of tax of $74 (235) ––––(235) –
Other comprehensive income activity, net of tax of nil 2–––– 2 –
Comprehensive income $÷«220 $«21
Dividends on common stock (302) – – (302) – – –
Dividends paid on noncontrolling interest/Other (2)–––– – (2)
Disposition of noncontrolling interest (25) –––– – (25)
Stock issuances – restricted stock 27–27––––
Stock option and benefit plans 19–19––––
Share repurchases and retirement (500) – (47) (453) – – –
ESOP tax benefit, redemptions and other 8–1–7 – –
Balances at July 3, 2010 $1,515 $7 $«17 $2,472 $÷(97) $(912) $«28
The accompanying Notes to Financial Statements are an integral part of these statements.