Sara Lee 2010 Annual Report Download - page 25
Download and view the complete annual report
Please find page 25 of the 2010 Sara Lee annual report below. You can navigate through the pages in the report by either clicking on the pages listed below, or by using the keyword search tool below to find specific information within the annual report.-
 1
1 -
2
-
3
-
4
-
5
-
6
-
7
-
8
-
9
-
10
-
11
-
12
-
13
-
14
-
 15
15 -
 16
16 -
 17
17 -
 18
18 -
 19
19 -
 20
20 -
 21
21 -
 22
22 -
 23
23 -
 24
24 -
 25
25 -
 26
26 -
 27
27 -
 28
28 -
 29
29 -
 30
30 -
 31
31 -
 32
32 -
 33
33 -
 34
34 -
 35
35 -
36
-
37
-
38
-
39
-
40
-
41
-
42
-
43
-
44
-
45
-
46
-
47
-
48
-
49
-
50
-
51
-
52
-
53
-
54
-
55
-
56
-
57
-
58
-
59
-
60
-
61
-
62
-
63
-
64
-
65
-
66
-
67
-
68
-
69
-
70
-
71
-
72
-
73
-
74
-
75
-
76
-
77
-
78
-
79
-
80
-
81
-
82
-
83
-
84
-
85
-
86
-
87
-
88
-
89
-
90
-
91
-
92
-
93
-
94
-
95
-
96
 |
 |

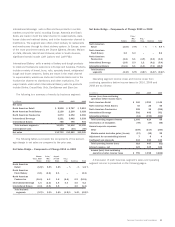
Sara Lee Corporation and Subsidiaries 23
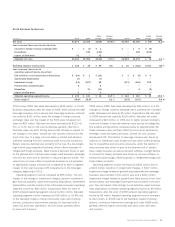
2009 versus 2008
Dollar Percent
In millions 2009 2008 Change Change
Net sales $10,882 $10,949 $÷(67) (0.6) %
Less: Increase/(decrease)
in net sales from
Changes in currency rates $÷÷÷÷«– $÷÷«361 $(361)
Acquisitions/dispositions 45 130 (85)
Adjusted net sales $10,837 $10,458 $«379 3.6 %
Operating income (loss) $÷÷«487 $÷÷÷(51) $«538 NM
Less: Increase/(decrease)
in operating income from
Contingent sale proceeds $÷÷«150 $÷÷«130 $÷«20
Changes in currency rates – 34 (34)
Exit activities, asset and
business dispositions (103) (39) (64)
Transformation/Accelerate
charges (21) (29) 8
Impairment charges (314) (851) 537
Curtailment gain 12 – 12
Pension partial withdrawal
liability charge (31) – (31)
Gain on property disposition 14 – 14
Balance sheet corrections 11 – 11
Accelerated depreciation – (1) 1
Acquisitions/dispositions 211
Adjusted operating income $÷÷«767 $÷÷«704 $÷«63 8.9 %
Net Sales Net sales in 2010 were $10,793 million, a decrease
of $89 million, or 0.8% versus 2009. Net sales were impacted by
changes in foreign currency exchange rates, particularly the European
euro, Brazilian real and Australian dollar, which increased reported
net sales by $152 million; dispositions net of acquisition after the
beginning of 2009, which reduced net sales by $131 million; and
the impact of the 53rd week, which increased net sales by $197 mil-
lion. Adjusted net sales decreased $307 million, or 2.8% due to lower
unit volumes and price reductions in response to lower commodity
costs and competitive pressures partially offset by an improved
sales mix.
Net sales were $10,882 million in 2009, a decrease of $67 mil-
lion, or 0.6% versus 2008. Changes in foreign currency exchange
rates, particularly the European euro, British pound, Brazilian real
and Australian dollar, decreased reported net sales by $361 mil-
lion. Dispositions net of acquisitions after the beginning of 2008
reduced net sales by $85 million. Adjusted net sales increased
$379 million, or 3.6% driven by price increases to offset higher
commodity costs and an improved sales mix, partially offset by
lower unit volumes.
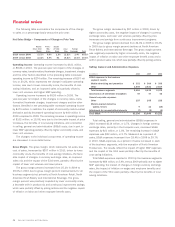
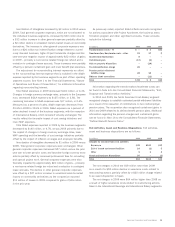
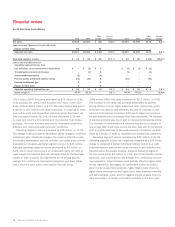
Review of Consolidated Results
The following tables summarize net sales and operating income for
2010 versus 2009, and 2009 versus 2008 and certain items that
affected the comparability of these amounts:
2010 versus 2009
Dollar Percent
In millions 2010 2009 Change Change
Net sales $10,793 $10,882 $÷(89) (0.8) %
Less: Increase/(decrease)
in net sales from
Changes in currency rates $÷÷÷÷«– $÷÷(152) $«152
Acquisitions/dispositions 12 143 (131)
Impact of 53rd week 197 – 197
Adjusted net sales $10,584 $10,891 $(307) (2.8) %
Operating income $÷÷«918 $÷÷«487 $«431 88.6 %
Less: Increase/(decrease)
in operating income from
Contingent sale proceeds $÷÷«133 $÷÷«150 $÷(17)
Changes in currency rates – (17) 17
Exit activities, asset and
business dispositions (84) (103) 19
Transformation/Accelerate
charges (23) (21) (2)
Accelerated depreciation (13) – (13)
Impairment charges (28) (314) 286
Curtailment gain 24 12 12
Pension partial withdrawal
liability charge (23) (31) 8
Gain on property disposition – 14 (14)
Mexican tax indemnification (26) – (26)
Balance sheet corrections – 11 (11)
Acquisitions/dispositions 1 11 (10)
Impact of 53rd week 25 – 25
Adjusted operating income $÷÷«932 $÷÷«775 $«157 20.2 %