Sara Lee 2010 Annual Report Download - page 89
Download and view the complete annual report
Please find page 89 of the 2010 Sara Lee annual report below. You can navigate through the pages in the report by either clicking on the pages listed below, or by using the keyword search tool below to find specific information within the annual report.-
 1
1 -
2
-
3
-
4
-
5
-
6
-
7
-
8
-
9
-
10
-
11
-
12
-
13
-
14
-
15
-
16
-
17
-
18
-
19
-
20
-
21
-
22
-
23
-
24
-
25
-
26
-
27
-
28
-
29
-
30
-
31
-
32
-
33
-
34
-
35
-
36
-
37
-
38
-
39
-
40
-
41
-
42
-
43
-
44
-
45
-
46
-
47
-
48
-
49
-
50
-
51
-
52
-
53
-
54
-
55
-
56
-
57
-
58
-
59
-
60
-
61
-
62
-
63
-
64
-
65
-
66
-
67
-
68
-
69
-
70
-
71
-
72
-
73
-
74
-
75
-
76
-
77
-
78
-
 79
79 -
 80
80 -
 81
81 -
 82
82 -
 83
83 -
 84
84 -
 85
85 -
 86
86 -
 87
87 -
 88
88 -
 89
89 -
 90
90 -
 91
91 -
 92
92 -
 93
93 -
 94
94 -
 95
95 -
 96
96
 |
 |

Sara Lee Corporation and Subsidiaries 87
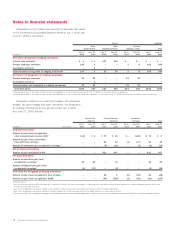
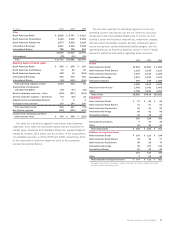
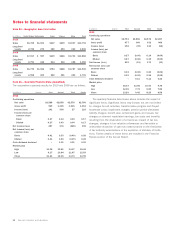
In millions 2010 2009 2008
Sales
North American Retail $÷2,818 $÷2,767 $÷2,613
North American Fresh Bakery 2,128 2,200 2,028
North American Foodservice 1,873 2,092 2,186
International Beverage 3,221 3,062 3,238
International Bakery 785 795 934
10,825 10,916 10,999
Intersegment (32) (34) (50)
Total $10,793 $10,882 $10,949
Operating Segment Income (Loss)
North American Retail $÷÷«346 $÷÷«253 $÷÷«149
North American Fresh Bakery 44 26 55
North American Foodservice 125 36 (324)
International Beverage 592 493 551
International Bakery (14) (194) (346)
Total operating segment income 1,093 614 85
Amortization of trademarks
and other intangibles (49) (47) (48)
General corporate expenses – other (249) (217) (244)
General corporate expenses – derivatives (17) (18) 22
Adjustment for noncontrolling interests 754
Contingent sale proceeds 133 150 130
Total operating income 918 487 (51)
Net interest expense (123) (129) (105)
Income from continuing operations
before income taxes $÷÷«795 $÷÷«358 $÷÷(156)
Net sales for a business segment may include sales between
segments. Such sales are at transfer prices that are equivalent to
market value. Revenues from Wal-Mart Stores Inc. represent approxi-
mately $1.6 billion, $1.4 billion and $1.2 billion of the corporation’s
consolidated revenues in 2010, 2009 and 2008, respectively. Each
of the corporation’s business segments sells to this customer,
except International Bakery.
The amounts reported for operating segment income and
operating income may include, but are not limited to, amounts
recognized in the Consolidated Statements of Income for exit
activities, asset and business dispositions, impairment charges,
transformation/Accelerate charges, pension curtailment gains/
losses and pension partial withdrawal liability charges. See the
Operating Results by Business Segment section of the Financial
Review for additional information regarding these amounts.
In millions 2010 2009 2008
Assets
North American Retail $1,293 $1,266 $÷1,287
North American Fresh Bakery 1,128 1,142 1,161
North American Foodservice 1,057 1,134 1,258
International Beverage 1,871 1,932 2,109
International Bakery 607 719 1,089
5,956 6,193 6,904
Net assets held for sale 1,092 1,342 1,663
Other11,788 1,884 2,264
Total assets $8,836 $9,419 $10,831
Depreciation
North American Retail $÷÷«97 $÷÷«95 $÷÷÷«92
North American Fresh Bakery 71 67 63
North American Foodservice 60 51 69
International Beverage 88 91 92
International Bakery 24 25 27
340 329 343
Discontinued operations 73236
Other 21 22 24
Total depreciation $÷«368 $÷«383 $÷÷«403
Additions to Long-Lived Assets
North American Retail $÷«163 $÷«110 $÷÷«149
North American Fresh Bakery 59 58 77
North American Foodservice 45 58 70
International Beverage 85 100 133
International Bakery 20 20 21
372 346 450
Other 72651
Total additions to long-lived assets $÷«379 $÷«372 $÷÷«501
1Principally cash and cash equivalents, certain corporate fixed assets, deferred tax assets
and certain other noncurrent assets.