Sara Lee 2010 Annual Report Download - page 38
Download and view the complete annual report
Please find page 38 of the 2010 Sara Lee annual report below. You can navigate through the pages in the report by either clicking on the pages listed below, or by using the keyword search tool below to find specific information within the annual report.-
 1
1 -
2
-
3
-
4
-
5
-
6
-
7
-
8
-
9
-
10
-
11
-
12
-
13
-
14
-
15
-
16
-
17
-
18
-
19
-
20
-
21
-
22
-
23
-
24
-
25
-
26
-
27
-
 28
28 -
 29
29 -
 30
30 -
 31
31 -
 32
32 -
 33
33 -
 34
34 -
 35
35 -
 36
36 -
 37
37 -
 38
38 -
 39
39 -
 40
40 -
 41
41 -
 42
42 -
 43
43 -
 44
44 -
 45
45 -
 46
46 -
 47
47 -
 48
48 -
49
-
50
-
51
-
52
-
53
-
54
-
55
-
56
-
57
-
58
-
59
-
60
-
61
-
62
-
63
-
64
-
65
-
66
-
67
-
68
-
69
-
70
-
71
-
72
-
73
-
74
-
75
-
76
-
77
-
78
-
79
-
80
-
81
-
82
-
83
-
84
-
85
-
86
-
87
-
88
-
89
-
90
-
91
-
92
-
93
-
94
-
95
-
96
 |
 |

2010 versus 2009
The cash used in investment activities in
2010 declined by $234 million from the prior year due primarily to
a $151 million increase in cash proceeds received from the dispo-
sition of businesses and a $112 million reduction in cash used in
derivative transactions.
The corporation received $204 million in 2010, primarily related
to the sale of its insecticide business in India. In 2009, it received
$53 million, of which $42 million was related to the disposition of
its DSD foodservice operations.
In 2010, $26 million of cash was used for derivative transactions,
as compared to $138 million in 2009, primarily driven by hedges of
foreign currency exposures.
The corporation spent $385 million for the purchase of property,
equipment, computer software and intangibles in 2010 as compared
to $379 million in 2009. The slightly higher level of spending in 2010
was to expand meat production capacity in North American Retail and
to implement new software to improve North American operations.
The corporation expects capital expenditures for property and equip-
ment to be approximately $400 - $450 million in 2011, an increase
over 2010 due to an increase in projected expenditures related to
expanded meat production capacity in North American Retail.
The amount of contingent sale proceeds received in 2010, was
$17 million lower than the prior year due to the impact of foreign
currency exchange rates as the corporation received €95 million
in both years.
2009 versus 2008
The cash used in investment activities in 2009
increased by $90 million over the prior year due to a $234 million
increase in cash used for derivative transactions partially offset by
a $136 million reduction in capital expenditures for property, equip-
ment and software.
In 2009, $138 million of cash was used for derivative transactions,
as compared to $96 million of cash received from derivative trans-
actions in 2008. The increase in cash used was due in part to
an increase in the number of mark-to-market derivative transactions
and an increase in cash paid on the settlement of foreign exchange
contracts, the majority of which were related to hedges of foreign
currency balance sheet exposures.
In 2009, the corporation incurred $379 million of expenditures
for property, equipment and software as compared to $515 million
in 2008. The year-over-year decrease was due to reduced spending
for information technology assets.
In 2009, the corporation expended $10 million as part of the
consideration paid for the acquisition of a coffee business in Brazil.
In 2008, the corporation did not expend any funds to make any
business acquisitions.
36 Sara Lee Corporation and Subsidiaries
Financial Condition
The corporation’s cash flow statements include amounts related to
discontinued operations through the date of disposal. The discontinued
operations had a significant impact on the cash flows from operating,
investing and financing activities in each fiscal year.
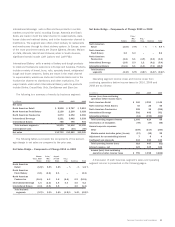
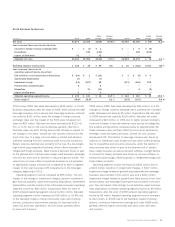
Cash from Operating Activities The cash from operating activities
generated by continuing and discontinued operations is summarized
in the following table:
2010 2009 2008
Cash from operating activities
Continuing operations $631 $640 $385
Discontinued operations 321 260 221
Total $952 $900 $606
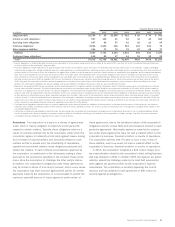
2010 versus 2009
The increase in cash from operating activities
of $52 million in 2010 was due primarily to improved operating
results and better working capital management with respect to
accounts payable and accounts receivable, which were partially
offset by an increase in cash payments for restructuring actions
and taxes as well as higher contributions to pension plans as
compared to the prior year.
2009 versus 2008
The increase in cash from operating activities
of $294 million in 2009 was due to a $451 improvement in the
cash used to fund working capital needs. In 2009, $119 million of
cash was generated from lower working capital levels as opposed
to $332 million of cash used in the prior year to fund working
capital needs. The year-over-year improvements were in accounts
receivable, inventories, accrued liabilities as well as a reduction in
cash tax payments, partially offset by an increase in cash used for
accounts payable. The overall improvement in working capital was
due in part to a strong focus on minimizing working capital levels.
The benefits generated from lower working capital levels were par-
tially offset by a $131 million increase in cash contributions to
pension plans as compared to the prior year.
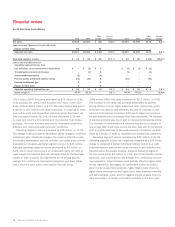
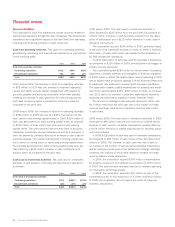
Cash used in Investment Activities Net cash used in investment
activities is split between continuing and discontinued operations
as follows:
2010 2009 2008
Cash used in investment activities
Continuing operations $(34) $(267) $(170)
Discontinued operations (18) (19) (26)
Total $(52) $(286) $(196)
Financial review