Sara Lee 2010 Annual Report Download - page 33
Download and view the complete annual report
Please find page 33 of the 2010 Sara Lee annual report below. You can navigate through the pages in the report by either clicking on the pages listed below, or by using the keyword search tool below to find specific information within the annual report.-
 1
1 -
2
-
3
-
4
-
5
-
6
-
7
-
8
-
9
-
10
-
11
-
12
-
13
-
14
-
15
-
16
-
17
-
18
-
19
-
20
-
21
-
22
-
 23
23 -
 24
24 -
 25
25 -
 26
26 -
 27
27 -
 28
28 -
 29
29 -
 30
30 -
 31
31 -
 32
32 -
 33
33 -
 34
34 -
 35
35 -
 36
36 -
 37
37 -
 38
38 -
 39
39 -
 40
40 -
 41
41 -
 42
42 -
 43
43 -
44
-
45
-
46
-
47
-
48
-
49
-
50
-
51
-
52
-
53
-
54
-
55
-
56
-
57
-
58
-
59
-
60
-
61
-
62
-
63
-
64
-
65
-
66
-
67
-
68
-
69
-
70
-
71
-
72
-
73
-
74
-
75
-
76
-
77
-
78
-
79
-
80
-
81
-
82
-
83
-
84
-
85
-
86
-
87
-
88
-
89
-
90
-
91
-
92
-
93
-
94
-
95
-
96
 |
 |

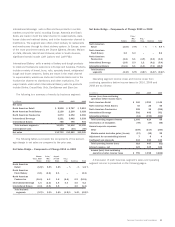
Sara Lee Corporation and Subsidiaries 31
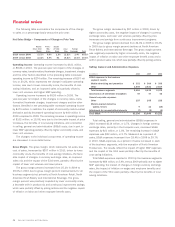
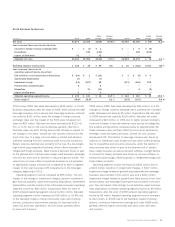
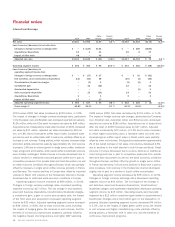
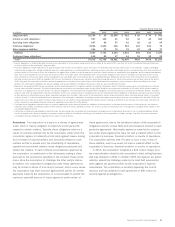
North American Retail
Dollar Percent Dollar Percent
In millions 2010 2009 Change Change 2009 2008 Change Change
Net sales $2,818 $2,767 $51 1.8% $2,767 $2,613 $154 5.9%
Less: Increase/(decrease) in net sales from
Impact of 53rd week 52–52 –––
Adjusted net sales $2,766 $2,767 $«(1) 0.0% $2,767 $2,613 $154 5.9%
Operating segment income $÷«346 $÷«253 $93 36.9% $÷«253 $«««149 $104 70.4%
Less: Increase/(decrease) in
operating segment income from
Exit activities, asset and business dispositions $÷÷÷(4) $÷÷÷«– $«(4) $÷«÷««– $««««(13) $««13
Transformation/Accelerate charges – – – – (1) 1
Pension curtailment gain 7–7 –––
Impairment charge – – – – (20) 20
Impact of 53rd week 5–5 –––
Adjusted operating segment income $÷«338 $÷«253 $85 33.7% $÷«253 $÷«183 $÷70 38.7%
Gross margin % 33.4% 28.8% 4.6% 28.8% 28.4 % 0.4%
2010 versus 2009
Net sales increased by $51 million, or 1.8%.
The increase was due to the impact of the 53rd week in 2010
as adjusted net sales were virtually unchanged. Sales increased
as a result of an improved sales mix driven in part by higher sales
in the breakfast sandwich, breakfast sausage, branded lunchmeat
and smoked sausage categories partially offset by the continuing
exit of the lower margin commodity hog business and the impact
of the exit of the kosher meat business in the third quarter of the
prior year. Pricing actions, net of trade promotions decreased net
sales by approximately 2%. The overall unit volume decline of 5.5%
was due to the continuing exit of the commodity hog business and
the exit of the kosher meat business. Unit volumes, excluding the
planned exit from the commodity meat and kosher meat businesses,
increased 2.7% due to higher volumes for breakfast sandwiches
and sausages, smoked sausages and sliced meats, which more
than offset volume declines for frozen bakery products.
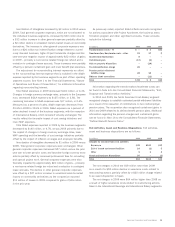
Operating segment income increased by $93 million, or 36.9%
due in part to a pension curtailment gain and the impact of the
53rd week, net of the negative impact of the change in exit activities
and asset and business dispositions, which increased operating
segment income by $8 million. Adjusted operating segment income
increased by $85 million, or 33.7%, due to lower commodity costs,
an improved sales mix, and savings from continuous improvement
programs, partially offset by increased trade promotions and higher
MAP and other SG&A costs.
2009 versus 2008
Net sales increased by $154 million, or 5.9%.
The increase in net sales was driven by pricing actions to offset
higher commodity and other raw material costs, which increased
net sales by approximately 6%, as well as an improved sales mix.
The improved sales mix related to a shift to higher-priced branded
products within the hot dogs, breakfast sausage and deli categories
as well as the introduction of new value-added products. These
improvements were partially offset by the negative impact of the
exit of the kosher meat business, the phasing out of the commodity
meats business and a decline in unit volumes. Unit volumes declined
2.0%, as volume growth in breakfast sausage, sliced meats, hot
dogs, corn dogs, and smoked sausage were offset by declines in
retail deli meat and frozen bakery products. Unit volume declines
were also the result of planned SKU rationalization, other margin
improvement initiatives and the continuing planned exit of the
commodity meats business.
Operating segment income increased by $104 million, or 70.4%.
The net impact of the change in exit activities, asset and business
dispositions, transformation/Accelerate charges and impairment
charges increased operating segment income by $34 million. Adjusted
operating segment income increased $70 million, or 38.7%, due
to the favorable impact of pricing actions; savings from continuous
improvement programs; and an improved product mix; which were
partially offset by higher commodity, labor and fuel costs and lower
unit volumes.