Reebok 2011 Annual Report Download - page 97
Download and view the complete annual report
Please find page 97 of the 2011 Reebok annual report below. You can navigate through the pages in the report by either clicking on the pages listed below, or by using the keyword search tool below to find specific information within the annual report.-
 1
1 -
2
-
3
-
4
-
5
-
6
-
7
-
8
-
9
-
10
-
11
-
12
-
13
-
14
-
15
-
16
-
17
-
18
-
19
-
20
-
21
-
22
-
23
-
24
-
25
-
26
-
27
-
28
-
29
-
30
-
31
-
32
-
33
-
34
-
35
-
36
-
37
-
38
-
39
-
40
-
41
-
42
-
43
-
44
-
45
-
46
-
47
-
48
-
49
-
50
-
51
-
52
-
53
-
54
-
55
-
56
-
57
-
58
-
59
-
60
-
61
-
62
-
63
-
64
-
65
-
66
-
67
-
68
-
69
-
70
-
71
-
72
-
73
-
74
-
75
-
76
-
77
-
78
-
79
-
80
-
81
-
82
-
83
-
84
-
85
-
86
-
 87
87 -
 88
88 -
 89
89 -
 90
90 -
 91
91 -
 92
92 -
 93
93 -
 94
94 -
 95
95 -
 96
96 -
 97
97 -
 98
98 -
 99
99 -
 100
100 -
 101
101 -
 102
102 -
 103
103 -
 104
104 -
 105
105 -
 106
106 -
 107
107 -
108
-
109
-
110
-
111
-
112
-
113
-
114
-
115
-
116
-
117
-
118
-
119
-
120
-
121
-
122
-
123
-
124
-
125
-
126
-
127
-
128
-
129
-
130
-
131
-
132
-
133
-
134
-
135
-
136
-
137
-
138
-
139
-
140
-
141
-
142
-
143
-
144
-
145
-
146
-
147
-
148
-
149
-
150
-
151
-
152
-
153
-
154
-
155
-
156
-
157
-
158
-
159
-
160
-
161
-
162
-
163
-
164
-
165
-
166
-
167
-
168
-
169
-
170
-
171
-
172
-
173
-
174
-
175
-
176
-
177
-
178
-
179
-
180
-
181
-
182
-
183
-
184
-
185
-
186
-
187
-
188
-
189
-
190
-
191
-
192
-
193
-
194
-
195
-
196
-
197
-
198
-
199
-
200
-
201
-
202
-
203
-
204
-
205
-
206
-
207
-
208
-
209
-
210
-
211
-
212
-
213
-
214
-
215
-
216
-
217
-
218
-
219
-
220
-
221
-
222
-
223
-
224
-
225
-
226
-
227
-
228
-
229
-
230
-
231
-
232
-
233
-
234
-
235
-
236
-
237
-
238
-
239
-
240
-
241
-
242
 |
 |

adidas Group
2011 Annual Report
GROUP MANAGEMENT REPORT – OUR GROUP
93
2011
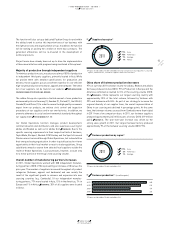
02.5 Global Operations
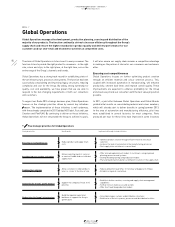
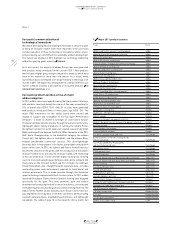
03 Suppliers by region 1)
1) Figures include adidas, Reebok and adidas Golf, but exclude local sourcing partners, sourcing
agents, subcontractors, second-tier suppliers and licensee factories.
2011
1 77% Asia
2 15% Americas
3 7% Europe
4 1% Africa
1
2
3 4
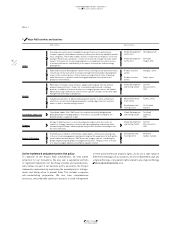
The function will also set up a dedicated Fashion Group for and within
the adidas brand to service this important area of our business with
the right processes and organisational set-up. In addition, the function
will be looking at pooling the creation of more basic products. The
generated efficiencies will be re-invested in the development of
technical products.
Project teams have already been set up to drive the implementation
of these new initiatives with progress being monitored at Group level.
Majority of production through independent suppliers
To minimise production costs, we outsource almost 100% of production
to independent third-party suppliers, primarily located in Asia. While
we provide them with detailed specifications for production and
delivery, these suppliers possess excellent expertise in cost-efficient
high-volume production of footwear, apparel and hardware. The latest
list of our suppliers can be found on our website :
WWW.ADIDAS-GROUP.
COM/EN/SUSTAINABILITY/SUPPLIERS_AND_WORKERS
.
The adidas Group also operates a limited amount of own production
and assembly sites in Germany (1), Sweden (1), Finland (1), the USA (4),
Canada (3) and China (1). In order to ensure the high quality consumers
expect from our products, we enforce strict control and inspection
procedures at our suppliers and in our own factories. In addition, we
promote adherence to social and environmental standards throughout
our supply chain
SEE SUSTAINABILITY, P. 107
.
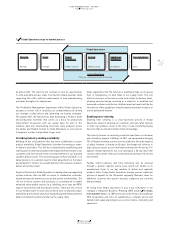
Our Global Operations function manages product development,
commercialisation and distribution, and also supervises sourcing for
adidas and Reebok as well as for adidas Golf
DIAGRAM 02
. Due to the
specific sourcing requirements in their respective fields of business,
TaylorMade, Rockport, Reebok-CCM Hockey and the Sports Licensed
Division are not serviced through Global Operations, but instead utilise
their own purchasing organisation. In order to quickly seize short-term
opportunities in their local market or react to trade regulations, Group
subsidiaries may also source from selected local suppliers outside the
realm of Global Operations. Local purchases, however, account only
for a minor portion of the Group’s total sourcing volume.
Overall number of manufacturing partners increases
In 2011, Global Operations worked with 308 independent manufac-
turing partners (2010: 270), representing an increase of 38 versus the
prior year. The number of suppliers increased throughout all product
categories (footwear, apparel and hardware) and was mainly the
result of the significant growth in volumes and expansion into new
sourcing countries (e.g. Cambodia). Of our independent manufac-
turing partners, 77% were located in Asia, 15% in the Americas, 7% in
Europe and 1% in Africa
DIAGRAM 03
. 30% of all suppliers were located
in China.
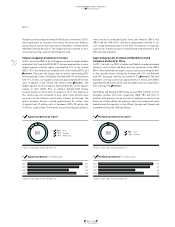
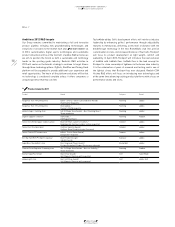
China share of footwear production decreases
97% of our total 2011 footwear volume for adidas, Reebok and adidas
Golf was produced in Asia (2010: 97%). Production in Europe and the
Americas combined accounted for 3% of the sourcing volume (2010:
3%)
DIAGRAM 04
. China represents our largest sourcing country with
approximately 35% of the total volume, followed by Vietnam with
29% and Indonesia with 26%. As part of our strategy to increase the
regional diversity of our supplier base, the overall representation of
China in our sourcing mix declined 4 percentage points. At the same
time, the footwear volumes sourced from Cambodia more than tripled
in 2011 from a low comparison base. In 2011, our footwear suppliers
produced approximately 245 million pairs of shoes (2010: 219 million
pairs)
DIAGRAM 05
. The year-over-year increase was driven by the
strong sales growth in 2011. Our largest footwear factory produced
approximately 9% of the footwear sourcing volume (2010: 9%).
04 Footwear production by region 1)
1) Figures include adidas, Reebok and adidas Golf.
2011 1 97% Asia
2 2% Americas
3 1% Europe
1
2 3
05 Footwear production 1) (in million pairs)
2011 245
2010 219
2009 171
2008 221
1) Figures include adidas, Reebok and adidas Golf.