Reebok 2011 Annual Report Download - page 126
Download and view the complete annual report
Please find page 126 of the 2011 Reebok annual report below. You can navigate through the pages in the report by either clicking on the pages listed below, or by using the keyword search tool below to find specific information within the annual report.-
 1
1 -
2
-
3
-
4
-
5
-
6
-
7
-
8
-
9
-
10
-
11
-
12
-
13
-
14
-
15
-
16
-
17
-
18
-
19
-
20
-
21
-
22
-
23
-
24
-
25
-
26
-
27
-
28
-
29
-
30
-
31
-
32
-
33
-
34
-
35
-
36
-
37
-
38
-
39
-
40
-
41
-
42
-
43
-
44
-
45
-
46
-
47
-
48
-
49
-
50
-
51
-
52
-
53
-
54
-
55
-
56
-
57
-
58
-
59
-
60
-
61
-
62
-
63
-
64
-
65
-
66
-
67
-
68
-
69
-
70
-
71
-
72
-
73
-
74
-
75
-
76
-
77
-
78
-
79
-
80
-
81
-
82
-
83
-
84
-
85
-
86
-
87
-
88
-
89
-
90
-
91
-
92
-
93
-
94
-
95
-
96
-
97
-
98
-
99
-
100
-
101
-
102
-
103
-
104
-
105
-
106
-
107
-
108
-
109
-
110
-
111
-
112
-
113
-
114
-
115
-
 116
116 -
 117
117 -
 118
118 -
 119
119 -
 120
120 -
 121
121 -
 122
122 -
 123
123 -
 124
124 -
 125
125 -
 126
126 -
 127
127 -
 128
128 -
 129
129 -
 130
130 -
 131
131 -
 132
132 -
 133
133 -
 134
134 -
 135
135 -
 136
136 -
137
-
138
-
139
-
140
-
141
-
142
-
143
-
144
-
145
-
146
-
147
-
148
-
149
-
150
-
151
-
152
-
153
-
154
-
155
-
156
-
157
-
158
-
159
-
160
-
161
-
162
-
163
-
164
-
165
-
166
-
167
-
168
-
169
-
170
-
171
-
172
-
173
-
174
-
175
-
176
-
177
-
178
-
179
-
180
-
181
-
182
-
183
-
184
-
185
-
186
-
187
-
188
-
189
-
190
-
191
-
192
-
193
-
194
-
195
-
196
-
197
-
198
-
199
-
200
-
201
-
202
-
203
-
204
-
205
-
206
-
207
-
208
-
209
-
210
-
211
-
212
-
213
-
214
-
215
-
216
-
217
-
218
-
219
-
220
-
221
-
222
-
223
-
224
-
225
-
226
-
227
-
228
-
229
-
230
-
231
-
232
-
233
-
234
-
235
-
236
-
237
-
238
-
239
-
240
-
241
-
242
 |
 |
adidas Group
2011 Annual Report
GROUP MANAGEMENT REPORT – FINANCIAL REVIEW
122
2011
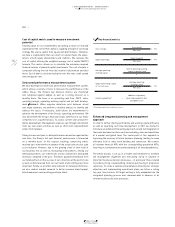
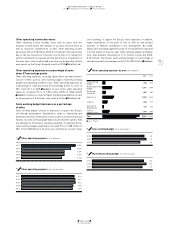
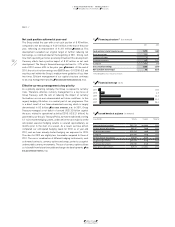
Group sales up in all product categories
In 2011, Group sales grew in all product categories on a currency-
neutral basis. Currency-neutral footwear sales increased 18% in
2011. This development was due to growth in the running, football,
outdoor and training categories. Apparel revenues increased 8%
on a currency-neutral basis, driven by growth in training, outdoor,
running and basketball. Currency-neutral hardware sales increased
10% compared to the prior year, primarily due to strong growth at
TaylorMade-adidas Golf. Currency translation effects had a negative
impact on sales in euro terms
TABLE 13
.
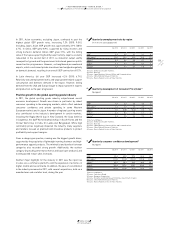
Cost of sales increases
Cost of sales is defined as the amount we pay to third parties for
expenses associated with producing and delivering our products.
Own-production expenses are also included in the Group’s cost of
sales. However, these expenses represent only a very small portion
of total cost of sales. In 2011, cost of sales was € 7.000 billion, repre-
senting an increase of 12% compared to € 6.260 billion in 2010.
This development was mainly due to increasing sourcing volumes
in footwear, apparel and hardware. In addition, the increase of input
costs as a result of higher raw material prices at the time of sourcing
negatively impacted the cost of sales development.
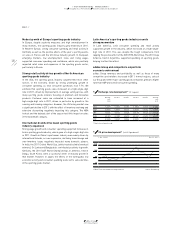
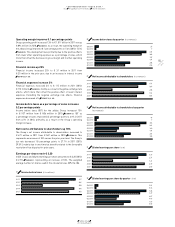
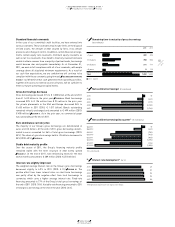
Group gross margin decreases 0.3 percentage points
The gross margin of the adidas Group decreased 0.3 percentage points
to 47.5% in 2011 (2010: 47.8%)
DIAGRAM 15
. The increase in input costs
more than offset the positive impact from a more favourable product
and regional sales mix as well as a larger share of higher-margin
03.2 Group Business Performance Income Statement
03.2
14 Gross profit (€ in millions)
2011 6,344
2010 5,730
2009 4,712
2008 5,256
2007 4,882
15 Gross margin (in %)
2011 47.5
2010 47.8
2009 45.4
2008 48.7
2007 47.4
16 Gross margin by quarter (in %)
Q4 2011 45.6
Q4 2010 46.5
Q3 2011 47.1
Q3 2010 47.3
Q2 2011 49.2
Q2 2010 48.9
Q1 2011 48.5
Q1 2010 48.6
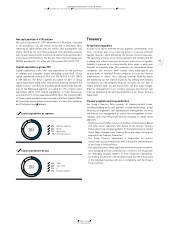
12 Net sales by product category
2011 1 47% Footwear
2 43% Apparel
3 10% Hardware
1
2
3
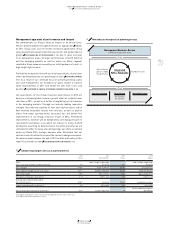
13 Net sales by product category (€ in millions)
2011 2010 Change Change
(currency-neutral)
Footwear 6,275 5,389 16% 18%
Apparel 5,734 5,380 7% 8%
Hardware 1,335 1,221 9% 10%
Total 1) 13,344 11,990 11% 13%
1) Rounding differences may arise in totals.
Retail sales. Gross profit for the adidas Group grew 11% in 2011 to
€ 6.344 billion versus € 5.730 billion in the prior year
DIAGRAM 14
.
Royalty and commission income declines
Royalty and commission income for the adidas Group decreased 6% to
€ 93 million in 2011 from € 100 million in the prior year. On a currency-
neutral basis, royalty and commission income was down 4%, mainly as
a result of lower licensee sales at Reebok.