Reebok 2011 Annual Report Download - page 159
Download and view the complete annual report
Please find page 159 of the 2011 Reebok annual report below. You can navigate through the pages in the report by either clicking on the pages listed below, or by using the keyword search tool below to find specific information within the annual report.-
 1
1 -
2
-
3
-
4
-
5
-
6
-
7
-
8
-
9
-
10
-
11
-
12
-
13
-
14
-
15
-
16
-
17
-
18
-
19
-
20
-
21
-
22
-
23
-
24
-
25
-
26
-
27
-
28
-
29
-
30
-
31
-
32
-
33
-
34
-
35
-
36
-
37
-
38
-
39
-
40
-
41
-
42
-
43
-
44
-
45
-
46
-
47
-
48
-
49
-
50
-
51
-
52
-
53
-
54
-
55
-
56
-
57
-
58
-
59
-
60
-
61
-
62
-
63
-
64
-
65
-
66
-
67
-
68
-
69
-
70
-
71
-
72
-
73
-
74
-
75
-
76
-
77
-
78
-
79
-
80
-
81
-
82
-
83
-
84
-
85
-
86
-
87
-
88
-
89
-
90
-
91
-
92
-
93
-
94
-
95
-
96
-
97
-
98
-
99
-
100
-
101
-
102
-
103
-
104
-
105
-
106
-
107
-
108
-
109
-
110
-
111
-
112
-
113
-
114
-
115
-
116
-
117
-
118
-
119
-
120
-
121
-
122
-
123
-
124
-
125
-
126
-
127
-
128
-
129
-
130
-
131
-
132
-
133
-
134
-
135
-
136
-
137
-
138
-
139
-
140
-
141
-
142
-
143
-
144
-
145
-
146
-
147
-
148
-
 149
149 -
 150
150 -
 151
151 -
 152
152 -
 153
153 -
 154
154 -
 155
155 -
 156
156 -
 157
157 -
 158
158 -
 159
159 -
 160
160 -
 161
161 -
 162
162 -
 163
163 -
 164
164 -
 165
165 -
 166
166 -
 167
167 -
 168
168 -
 169
169 -
170
-
171
-
172
-
173
-
174
-
175
-
176
-
177
-
178
-
179
-
180
-
181
-
182
-
183
-
184
-
185
-
186
-
187
-
188
-
189
-
190
-
191
-
192
-
193
-
194
-
195
-
196
-
197
-
198
-
199
-
200
-
201
-
202
-
203
-
204
-
205
-
206
-
207
-
208
-
209
-
210
-
211
-
212
-
213
-
214
-
215
-
216
-
217
-
218
-
219
-
220
-
221
-
222
-
223
-
224
-
225
-
226
-
227
-
228
-
229
-
230
-
231
-
232
-
233
-
234
-
235
-
236
-
237
-
238
-
239
-
240
-
241
-
242
 |
 |

adidas Group
2011 Annual Report
GROUP MANAGEMENT REPORT – FINANCIAL REVIEW
155
2011
03.4 Risk and Opportunity Report Financial risks
Other activities to mitigate credit risks include retention of title
clauses as well as, on a selective basis, credit insurances, accounts
receivable sales without recourse and bank guarantees.
Objective evidence that financial assets are impaired includes, for
instance, significant financial difficulty of the issuer or debtor, indica-
tions of the potential bankruptcy of the borrower and the disap-
pearance of an active market for a financial asset because of financial
difficulties. The Group utilises allowance accounts for impairments
that represent our estimate of incurred credit losses with respect to
accounts receivable.
Allowance accounts are used as long as the Group is satisfied that
recovery of the amount due is possible. Once this is no longer the
case, the amounts are considered irrecoverable and are directly
written off against the financial asset. The allowance consists of two
components:
(1) an allowance established for all receivables dependent on the
ageing structure of receivables past due date and
(2) a specific allowance that relates to individually assessed risk for
each specific customer – irrespective of ageing.
At the end of 2011, no Group customer accounted for more than 10% of
accounts receivable. We therefore believe that the potential financial
impact of our credit risks from customers, particularly smaller
retailers, is moderate and we rate the likelihood of occurrence as
possible.
The adidas Group Treasury department arranges currency and
interest rate hedges, and invests cash, with major banks of a high
credit standing throughout the world. adidas Group companies are
authorised to work with banks rated BBB+ or higher. Only in excep-
tional cases are subsidiaries authorised to work with banks rated
lower than BBB+. To limit risk in these cases, restrictions are clearly
stipulated, such as maximum cash deposit levels. In addition, the
credit default swap premiums of our partner banks are monitored on
a weekly basis. In the event that the defined threshold is exceeded,
credit balances are shifted to banks compliant with the limit.
As financial market conditions remain challenging and highly volatile,
our assessment of credit risks from these assets is unchanged. We
continue to believe that the potential financial impact is moderate
and the likelihood of occurrence is possible. Nevertheless, we believe
our risk concentration is limited due to the broad distribution of our
investment business with more than 20 banks. At December 31, 2011,
no bank accounted for more than 9% of our investments and the
average concentration, including subsidiaries’ short-term deposits in
local banks, was 1%. This leads to a maximum exposure of € 97 million
in the event of default of any single bank. We have further diversified
our investment exposure by investing into AAA-rated money market
funds.
In addition, we held derivatives with a positive fair market value in the
amount of € 181 million. The maximum exposure to any single bank
resulting from these assets amounted to € 28 million and the average
concentration was 4%.
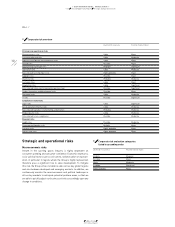
Financing and liquidity risks
Liquidity risks arise from not having the necessary resources available
to meet maturing liabilities with regard to timing, volume and currency
structure. In addition, the adidas Group faces the risk of having to
accept unfavourable financing terms due to liquidity restraints. Our
Group Treasury department uses an efficient cash management
system to manage liquidity risk. At December 31, 2011, Group cash
and cash equivalents amounted to € 906 million (2010: € 1.156 billion).
Moreover, our Group maintains € 2.164 billion bilateral short-term
credit lines and a € 1.860 billion committed short-term syndicated
loan facility with international banks, which does not include a market
disruption clause. The € 4.024 billion in credit lines are designed to
ensure sufficient liquidity at all times
SEE TREASURY, P. 129
.
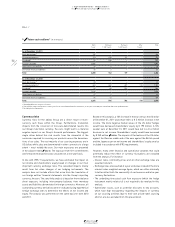
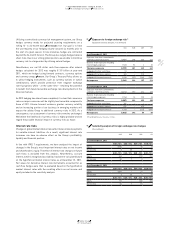
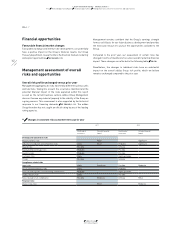
Future cash outflows arising from financial liabilities that are recog-
nised in the Consolidated Statement of Financial Position are
presented in the following table
TABLE 04
.
This includes payments to settle obligations from borrowings as well
as cash outflows from cash-settled derivatives with negative market
values. Financial liabilities that may be settled in advance without
penalty are included on the basis of the earliest date of potential
repayment. Cash flows for variable-interest liabilities are determined
with reference to the conditions at the balance sheet date.
In 2011, we continued to improve our financial position substan-
tially as we ended the year with net cash of € 90 million (2010: net
borrowings of € 221 million). Thus the ratio of net borrowings over
EBITDA improved to -0.1 times at year-end, which is well in line with
the Group’s medium-term guideline of less than two times. In the light
of our available credit lines, financing structure and business model,
we assess the likelihood of occurrence of financing and liquidity risks
as unlikely, and therefore expect only a minor potential financial
impact on the Group.