Reebok 2011 Annual Report Download - page 147
Download and view the complete annual report
Please find page 147 of the 2011 Reebok annual report below. You can navigate through the pages in the report by either clicking on the pages listed below, or by using the keyword search tool below to find specific information within the annual report.-
 1
1 -
2
-
3
-
4
-
5
-
6
-
7
-
8
-
9
-
10
-
11
-
12
-
13
-
14
-
15
-
16
-
17
-
18
-
19
-
20
-
21
-
22
-
23
-
24
-
25
-
26
-
27
-
28
-
29
-
30
-
31
-
32
-
33
-
34
-
35
-
36
-
37
-
38
-
39
-
40
-
41
-
42
-
43
-
44
-
45
-
46
-
47
-
48
-
49
-
50
-
51
-
52
-
53
-
54
-
55
-
56
-
57
-
58
-
59
-
60
-
61
-
62
-
63
-
64
-
65
-
66
-
67
-
68
-
69
-
70
-
71
-
72
-
73
-
74
-
75
-
76
-
77
-
78
-
79
-
80
-
81
-
82
-
83
-
84
-
85
-
86
-
87
-
88
-
89
-
90
-
91
-
92
-
93
-
94
-
95
-
96
-
97
-
98
-
99
-
100
-
101
-
102
-
103
-
104
-
105
-
106
-
107
-
108
-
109
-
110
-
111
-
112
-
113
-
114
-
115
-
116
-
117
-
118
-
119
-
120
-
121
-
122
-
123
-
124
-
125
-
126
-
127
-
128
-
129
-
130
-
131
-
132
-
133
-
134
-
135
-
136
-
 137
137 -
 138
138 -
 139
139 -
 140
140 -
 141
141 -
 142
142 -
 143
143 -
 144
144 -
 145
145 -
 146
146 -
 147
147 -
 148
148 -
 149
149 -
 150
150 -
 151
151 -
 152
152 -
 153
153 -
 154
154 -
 155
155 -
 156
156 -
 157
157 -
158
-
159
-
160
-
161
-
162
-
163
-
164
-
165
-
166
-
167
-
168
-
169
-
170
-
171
-
172
-
173
-
174
-
175
-
176
-
177
-
178
-
179
-
180
-
181
-
182
-
183
-
184
-
185
-
186
-
187
-
188
-
189
-
190
-
191
-
192
-
193
-
194
-
195
-
196
-
197
-
198
-
199
-
200
-
201
-
202
-
203
-
204
-
205
-
206
-
207
-
208
-
209
-
210
-
211
-
212
-
213
-
214
-
215
-
216
-
217
-
218
-
219
-
220
-
221
-
222
-
223
-
224
-
225
-
226
-
227
-
228
-
229
-
230
-
231
-
232
-
233
-
234
-
235
-
236
-
237
-
238
-
239
-
240
-
241
-
242
 |
 |
adidas Group
2011 Annual Report
GROUP MANAGEMENT REPORT – FINANCIAL REVIEW
143
2011
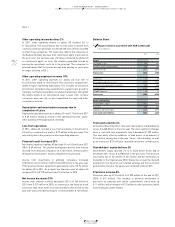
03.3 Business Performance by Segment Other Businesses Performance
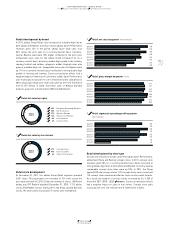
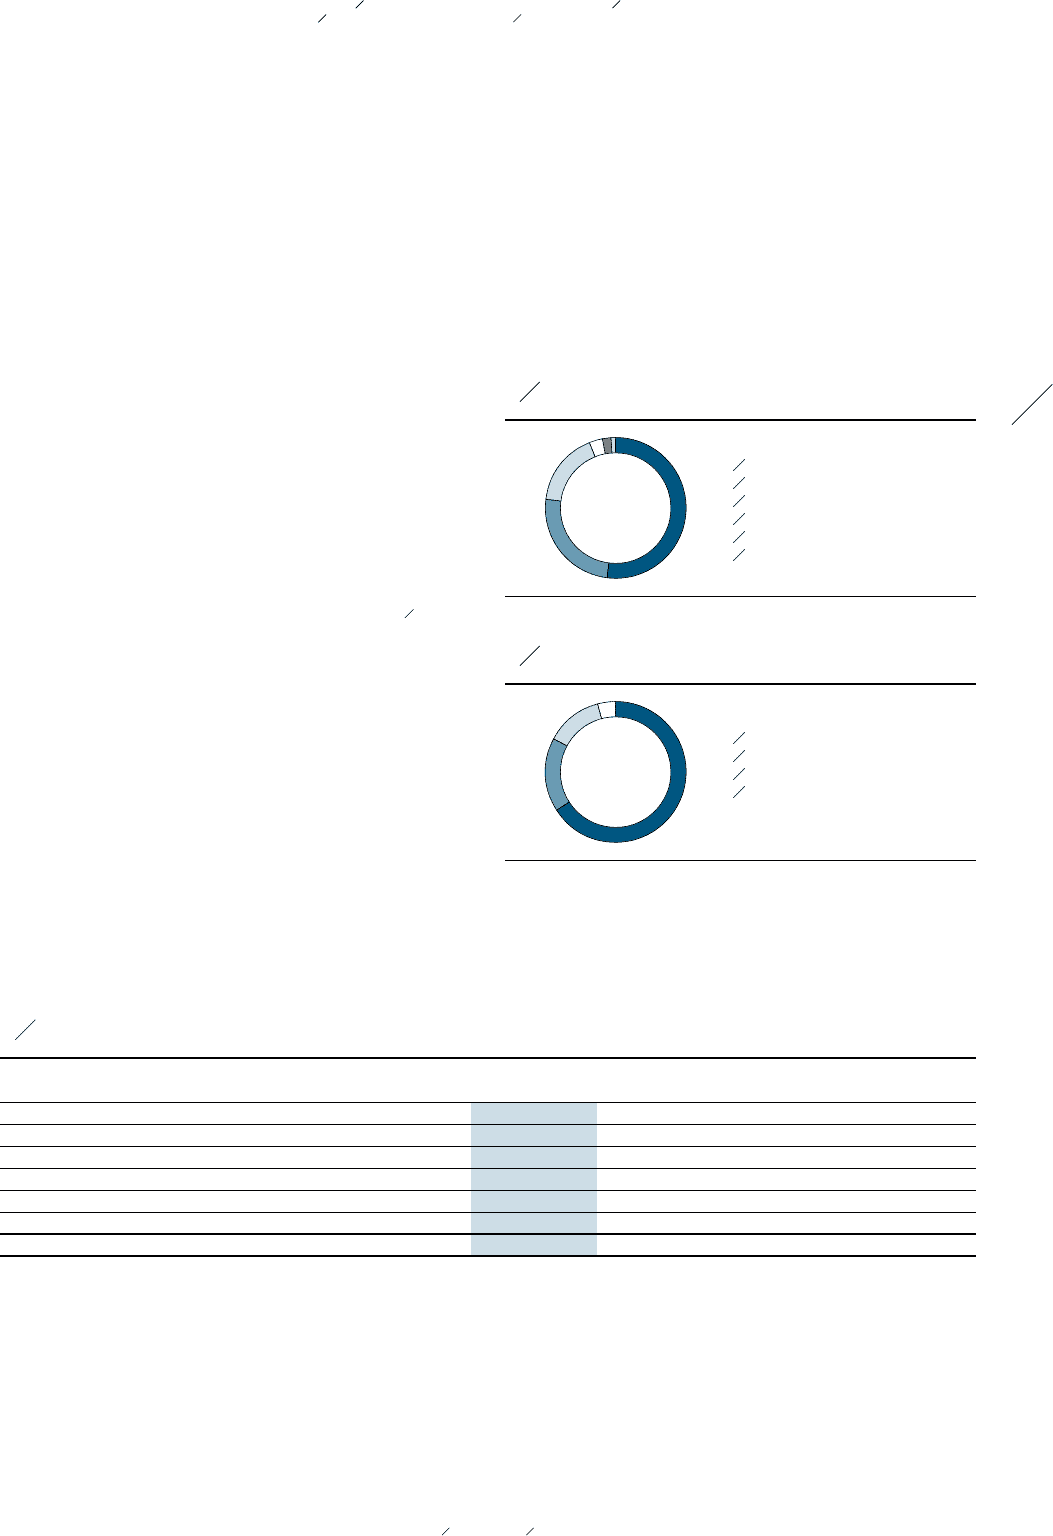
19 Other Businesses net sales by segment
2011
1 66% TaylorMade-adidas Golf
2 17% Rockport
3 13% Reebok-CCM Hockey
4 4% Other Centrally Managed
Brands
1
2
3
18 Other Businesses net sales by region
2011
1 52% North America
2 25% Other Asian Markets
3 17% Western Europe
4 3% European Emerging Markets
5 2% Greater China
6 1% Latin America
6
5
1
2
3
4
4
Other Businesses development by region
Currency-neutral sales of Other Businesses increased in all regions.
Revenues in Western Europe were up 11% on a currency-neutral
basis due to double-digit sales growth at TaylorMade-adidas Golf,
partly offset by declines at Rockport and Reebok-CCM Hockey. Sales
in European Emerging Markets increased 35% on a currency-neutral
basis, driven by strong double-digit growth at TaylorMade-adidas Golf
and Rockport. Reebok-CCM Hockey sales were also up at a double-
digit rate. Currency-neutral sales in North America rose 17%, due
to strong double-digit growth at TaylorMade-adidas Golf. Sales at
Rockport and Reebok-CCM Hockey also increased on a currency-
neutral basis. Revenues in Greater China were up 22% on a currency-
neutral basis as a result of strong growth at TaylorMade-adidas Golf.
Sales in Other Asian Markets grew 4% on a currency-neutral basis, due
to increases at TaylorMade-adidas Golf as well as Rockport. In Latin
America, currency-neutral sales grew 20%, as a result of double-digit
growth at Rockport and TaylorMade-adidas Golf. Currency translation
effects had a mixed impact on regional sales in euro terms
TABLE 17
.
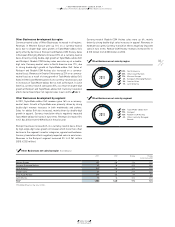
Other Businesses development by segment
In 2011, TaylorMade-adidas Golf revenues grew 16% on a currency-
neutral basis. Growth at TaylorMade was primarily driven by strong
double-digit revenue increases in both metalwoods and putters.
Sales for adidas Golf also increased, mainly driven by double-digit
growth in apparel. Currency translation effects negatively impacted
TaylorMade-adidas Golf sales in euro terms. Revenues increased 15%
to € 1.044 billion from € 909 million in the prior year.
Rockport revenues increased 6% on a currency-neutral basis, driven
by high-single-digit sales growth in footwear which more than offset
declines in the segment’s smaller categories, apparel and hardware.
Currency translation effects negatively impacted sales in euro terms.
Revenues in the Rockport segment increased 3% to € 261 million
(2010: € 252 million).
Currency-neutral Reebok-CCM Hockey sales were up 6%, mainly
driven by strong double-digit sales increases in apparel. Revenues in
hardware also grew. Currency translation effects negatively impacted
sales in euro terms. Reebok-CCM Hockey revenues increased 5% to
€ 210 million from € 200 million in 2010.
17 Other Businesses net sales by region (€ in millions)
2011 2010 Change Change
(currency-neutral)
Western Europe 259 235 11% 11%
European Emerging Markets 45 35 29% 35%
North America 827 735 12% 17%
Greater China 34 29 21% 22%
Other Asian Markets 398 372 7% 4%
Latin America 15 14 14% 20%
Total 1) 1,580 1,420 11% 13%
1) Rounding differences may arise in totals.