Reebok 2011 Annual Report Download - page 135
Download and view the complete annual report
Please find page 135 of the 2011 Reebok annual report below. You can navigate through the pages in the report by either clicking on the pages listed below, or by using the keyword search tool below to find specific information within the annual report.-
 1
1 -
2
-
3
-
4
-
5
-
6
-
7
-
8
-
9
-
10
-
11
-
12
-
13
-
14
-
15
-
16
-
17
-
18
-
19
-
20
-
21
-
22
-
23
-
24
-
25
-
26
-
27
-
28
-
29
-
30
-
31
-
32
-
33
-
34
-
35
-
36
-
37
-
38
-
39
-
40
-
41
-
42
-
43
-
44
-
45
-
46
-
47
-
48
-
49
-
50
-
51
-
52
-
53
-
54
-
55
-
56
-
57
-
58
-
59
-
60
-
61
-
62
-
63
-
64
-
65
-
66
-
67
-
68
-
69
-
70
-
71
-
72
-
73
-
74
-
75
-
76
-
77
-
78
-
79
-
80
-
81
-
82
-
83
-
84
-
85
-
86
-
87
-
88
-
89
-
90
-
91
-
92
-
93
-
94
-
95
-
96
-
97
-
98
-
99
-
100
-
101
-
102
-
103
-
104
-
105
-
106
-
107
-
108
-
109
-
110
-
111
-
112
-
113
-
114
-
115
-
116
-
117
-
118
-
119
-
120
-
121
-
122
-
123
-
124
-
 125
125 -
 126
126 -
 127
127 -
 128
128 -
 129
129 -
 130
130 -
 131
131 -
 132
132 -
 133
133 -
 134
134 -
 135
135 -
 136
136 -
 137
137 -
 138
138 -
 139
139 -
 140
140 -
 141
141 -
 142
142 -
 143
143 -
 144
144 -
 145
145 -
146
-
147
-
148
-
149
-
150
-
151
-
152
-
153
-
154
-
155
-
156
-
157
-
158
-
159
-
160
-
161
-
162
-
163
-
164
-
165
-
166
-
167
-
168
-
169
-
170
-
171
-
172
-
173
-
174
-
175
-
176
-
177
-
178
-
179
-
180
-
181
-
182
-
183
-
184
-
185
-
186
-
187
-
188
-
189
-
190
-
191
-
192
-
193
-
194
-
195
-
196
-
197
-
198
-
199
-
200
-
201
-
202
-
203
-
204
-
205
-
206
-
207
-
208
-
209
-
210
-
211
-
212
-
213
-
214
-
215
-
216
-
217
-
218
-
219
-
220
-
221
-
222
-
223
-
224
-
225
-
226
-
227
-
228
-
229
-
230
-
231
-
232
-
233
-
234
-
235
-
236
-
237
-
238
-
239
-
240
-
241
-
242
 |
 |

adidas Group
2011 Annual Report
GROUP MANAGEMENT REPORT – FINANCIAL REVIEW
131
2011
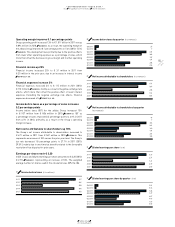
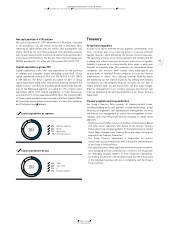
03.2 Group Business Performance Treasury
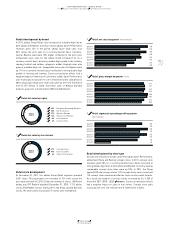
48 Net cash/(net borrowings) (€ in millions)
2011 90
2010 (221)
2009 (917)
2008 (2,189)
2007 (1,766)
50 Interest rate development 1) (in %)
2011 4.9
2010 5.1
2009 5.2
2008 5.2
2007 5.3
1) Weighted average interest rate of gross borrowings.
49 Net cash/(net borrowings) by quarter 1) (€ in millions)
Q4 2011 90
Q4 2010 (221)
Q3 2011 (750)
Q3 2010 (903)
Q2 2011 (863)
Q2 2010 (1,090)
Q1 2011 (914)
Q1 2010 (1,359)
1) At end of period.
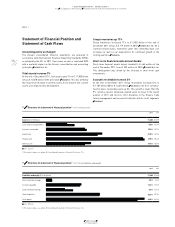
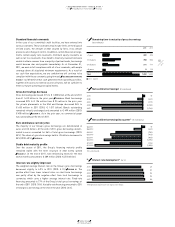
47 Remaining time to maturity of gross borrowings
(€ in millions)
2011 2010
< 1 year 289 273
1 to 3 years 780 514
3 to 5 years 211 711
> 5 years 0112
Total 1,280 1,610
■ 2011 ■ 2010
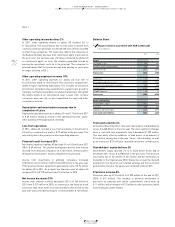
Standard financial covenants
In the case of our committed credit facilities, we have entered into
various covenants. These covenants may include limits on the disposal
of fixed assets, the amount of debt secured by liens, cross default
provisions and change of control. In addition, certain financial arrange-
ments contain equity ratio covenants, minimum equity covenants as
well as net loss covenants. If we failed to meet any covenant and were
unable to obtain a waiver from a majority of partner banks, borrowings
would become due and payable immediately. As at December 31,
2011, we were in full compliance with all of our covenants, with ample
coverage above all stipulated minimum requirements. As a result of
our cash flow expectations, we are confident we will continue to be
compliant with these covenants going forward
SEE SUBSEQUENT EVENTS AND
OUTLOOK, P. 163
. We believe that cash generated from operating activities,
together with access to external sources of funds, will be sufficient to
meet our future operating and capital needs.
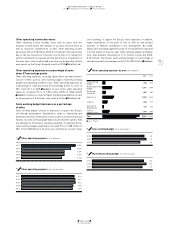
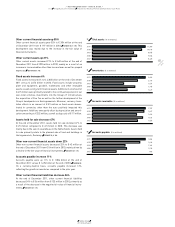
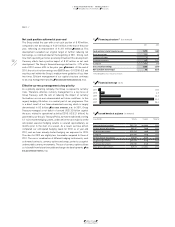
Gross borrowings decrease
Gross borrowings decreased 21% to € 1.280 billion at the end of 2011
from € 1.610 billion in the prior year
DIAGRAM 46
. Bank borrowings
increased 33% to € 126 million from € 95 million in the prior year.
Our private placements in the USA and Europe decreased 36% to
€ 655 million in 2011 (2010: € 1.017 billion). Bonds outstanding
remained virtually unchanged and amounted to € 499 million (2010:
€ 498 million)
DIAGRAM 51
. As in the prior year, no commercial paper
was outstanding at the end of 2011.
Euro dominates currency mix
The majority of our Group’s gross borrowings are denominated in
euros and US dollars. At the end of 2011, gross borrowings denom-
inated in euros accounted for 56% of total gross borrowings (2010:
55%). The share of gross borrowings held in US dollars decreased to
35% (2010: 40%)
DIAGRAM 46
.
Stable debt maturity profile
Over the course of 2011, the Group’s financing maturity profile
remained stable with the term structure of debt evenly spread
DIAGRAM 47
. At the end of 2011, total refinancing needs for the next
twelve months amounted to € 289 million (2010: € 273 million).
Interest rate slightly improved
The weighted average interest rate on the Group’s gross borrowings
decreased slightly to 4.9% in 2011 (2010: 5.1%)
DIAGRAM 50
. The
positive effect from lower interest rates on short-term borrowings
was partly offset by the negative effect from local borrowings in
currencies which carry a higher average interest rate. Fixed-rate
financing amounted to 77% of the Group’s total gross borrowings at
the end of 2011 (2010: 76%). Variable-rate financing amounted to 23%
of total gross borrowings at the end of the year (2010: 24%).