Reebok 2011 Annual Report Download - page 123
Download and view the complete annual report
Please find page 123 of the 2011 Reebok annual report below. You can navigate through the pages in the report by either clicking on the pages listed below, or by using the keyword search tool below to find specific information within the annual report.-
 1
1 -
2
-
3
-
4
-
5
-
6
-
7
-
8
-
9
-
10
-
11
-
12
-
13
-
14
-
15
-
16
-
17
-
18
-
19
-
20
-
21
-
22
-
23
-
24
-
25
-
26
-
27
-
28
-
29
-
30
-
31
-
32
-
33
-
34
-
35
-
36
-
37
-
38
-
39
-
40
-
41
-
42
-
43
-
44
-
45
-
46
-
47
-
48
-
49
-
50
-
51
-
52
-
53
-
54
-
55
-
56
-
57
-
58
-
59
-
60
-
61
-
62
-
63
-
64
-
65
-
66
-
67
-
68
-
69
-
70
-
71
-
72
-
73
-
74
-
75
-
76
-
77
-
78
-
79
-
80
-
81
-
82
-
83
-
84
-
85
-
86
-
87
-
88
-
89
-
90
-
91
-
92
-
93
-
94
-
95
-
96
-
97
-
98
-
99
-
100
-
101
-
102
-
103
-
104
-
105
-
106
-
107
-
108
-
109
-
110
-
111
-
112
-
 113
113 -
 114
114 -
 115
115 -
 116
116 -
 117
117 -
 118
118 -
 119
119 -
 120
120 -
 121
121 -
 122
122 -
 123
123 -
 124
124 -
 125
125 -
 126
126 -
 127
127 -
 128
128 -
 129
129 -
 130
130 -
 131
131 -
 132
132 -
 133
133 -
134
-
135
-
136
-
137
-
138
-
139
-
140
-
141
-
142
-
143
-
144
-
145
-
146
-
147
-
148
-
149
-
150
-
151
-
152
-
153
-
154
-
155
-
156
-
157
-
158
-
159
-
160
-
161
-
162
-
163
-
164
-
165
-
166
-
167
-
168
-
169
-
170
-
171
-
172
-
173
-
174
-
175
-
176
-
177
-
178
-
179
-
180
-
181
-
182
-
183
-
184
-
185
-
186
-
187
-
188
-
189
-
190
-
191
-
192
-
193
-
194
-
195
-
196
-
197
-
198
-
199
-
200
-
201
-
202
-
203
-
204
-
205
-
206
-
207
-
208
-
209
-
210
-
211
-
212
-
213
-
214
-
215
-
216
-
217
-
218
-
219
-
220
-
221
-
222
-
223
-
224
-
225
-
226
-
227
-
228
-
229
-
230
-
231
-
232
-
233
-
234
-
235
-
236
-
237
-
238
-
239
-
240
-
241
-
242
 |
 |

adidas Group
2011 Annual Report
GROUP MANAGEMENT REPORT – FINANCIAL REVIEW
119
2011
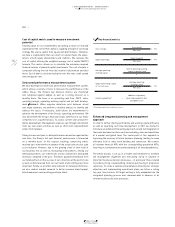
03.2 Group Business Performance Economic and Sector Development
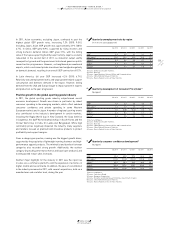
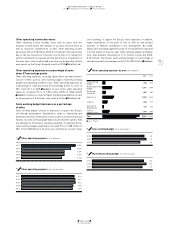
02 Quarterly unemployment rate by region
(in % of total active population)
Q4 2010 Q1 2011 Q2 2011 Q3 2011 Q4 2011
USA 1) 9.6 9.0 9.1 9.1 8.7
Euro area 2) 10.0 10.0 10.0 10.3 10.4
Japan 3) 4.9 4.6 4.6 4.1 4.6
China 4) 4.1 4.1 4.1 4.1 4.1
Russia 5) 7.2 7.1 6.1 6.0 6.1
1) Source: US Bureau of Labor Statistics.
2) Source: Eurostat.
3) Source: Japan Ministry of Internal Affairs and Communications.
4) Source: China National Bureau of Statistics.
5) Source: Russia Federal Service of State Statistics.
03 Quarterly development of Consumer Price Index 1)
(by region)
Q4 2010 Q1 2011 Q2 2011 Q3 2011 Q4 2011
USA 2) 1.5 2.7 3.6 3.9 3.0
Euro area 3) 2.2 2.7 2.7 3.0 2.7
Japan 4) 0.0 (0.5) (0.4) 0.0 (0.2)
China 5) 4.6 5.4 6.4 6.1 4.1
Russia 6) 8.8 9.5 9.4 7.2 6.1
1) Quarter-end figures.
2) Source: US Bureau of Labor Statistics.
3) Source: Eurostat.
4) Source: Japan Ministry of Internal Affairs and Communications.
5) Source: China National Bureau of Statistics.
6) Source: Russia Federal Service of State Statistics.
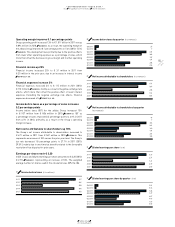
04 Quarterly consumer confidence development 1)
(by region)
Q4 2010 Q1 2011 Q2 2011 Q3 2011 Q4 2011
USA 2) 63.4 63.8 57.6 46.4 64.8
Euro area 3) (11.0) (11.0) (10.0) (19.3) (21.3)
Japan 4) 40.2 38.3 36.3 38.5 38.1
China 5) 100.4 107.6 108.1 103.4 97.0
Russia 6) (10.0) (13.0) (9.0) (7.0) (7.0)
1) Quarter-end figures.
2) Source: Conference Board.
3) Source: European Commission.
4) Source: Economic and Social Research Institute, Government of Japan.
5) Source: China National Bureau of Statistics.
6) Source: Russia Federal Service of State Statistics.
In 2011, Asian economies, excluding Japan, continued to post the
highest global GDP growth rates, increasing 7.2% (2010: 9.0%).
Including Japan, Asian GDP growth was approximately 3.9% (2010:
6.7%). In China, GDP grew 8.9%, supported by rising incomes and
strong domestic demand. India’s GDP grew 7.5%, with the falling
value of the rupee supporting healthy export activity. Japan’s economy
rebounded in the second half of 2011, as industrial output swiftly
recouped lost ground and the government introduced generous public
reconstruction programmes. However, a strengthened yen weakened
exports, which constrained private investment and weighed negatively
on domestic demand, resulting in an overall GDP contraction of 0.7%.
In Latin America, full year GDP increased 4.2% (2010: 6.7%).
Relatively low unemployment levels and wage growth helped support
consumption and domestic demand in the region. However, falling
demand from the USA and Europe began to impact growth in exports
and production as the year progressed.
Positive growth in the global sporting goods industry
In 2011, the global sporting goods industry outperformed overall
economic development. Growth was driven in particular by robust
consumer spending in the emerging markets, which offset subdued
consumer confidence and private spending in some Western
European markets and in Japan. A number of regional sporting events
also contributed to the industry’s development in certain markets,
including the Rugby World Cup in New Zealand, the Copa América
in Argentina, the IAAF World Championships in South Korea and the
Cricket World Cup in India, Sri Lanka and Bangladesh. While high
commodity prices negatively impacted the industry, many suppliers
and retailers focused on premium and innovative products to protect
profitability and support margins.
From a category perspective, running was the biggest growth driver,
supported by the popularity of lightweight running footwear and high-
performance apparel products. The minimalist and barefoot footwear
categories also recorded strong growth. Additionally, the outdoor
category (especially performance fleece and base layer products) and
training posted robust sales increases.
Another major highlight for the industry in 2011 was the rapid rise
in sales via e-commerce platforms and the expansion of activities in
digital, mobile and social media. In addition, the pace of consolidation
in the industry increased in 2011, with several acquisitions, both on a
manufacturer and a retailer level, during the year.