Reebok 2011 Annual Report Download - page 127
Download and view the complete annual report
Please find page 127 of the 2011 Reebok annual report below. You can navigate through the pages in the report by either clicking on the pages listed below, or by using the keyword search tool below to find specific information within the annual report.-
 1
1 -
2
-
3
-
4
-
5
-
6
-
7
-
8
-
9
-
10
-
11
-
12
-
13
-
14
-
15
-
16
-
17
-
18
-
19
-
20
-
21
-
22
-
23
-
24
-
25
-
26
-
27
-
28
-
29
-
30
-
31
-
32
-
33
-
34
-
35
-
36
-
37
-
38
-
39
-
40
-
41
-
42
-
43
-
44
-
45
-
46
-
47
-
48
-
49
-
50
-
51
-
52
-
53
-
54
-
55
-
56
-
57
-
58
-
59
-
60
-
61
-
62
-
63
-
64
-
65
-
66
-
67
-
68
-
69
-
70
-
71
-
72
-
73
-
74
-
75
-
76
-
77
-
78
-
79
-
80
-
81
-
82
-
83
-
84
-
85
-
86
-
87
-
88
-
89
-
90
-
91
-
92
-
93
-
94
-
95
-
96
-
97
-
98
-
99
-
100
-
101
-
102
-
103
-
104
-
105
-
106
-
107
-
108
-
109
-
110
-
111
-
112
-
113
-
114
-
115
-
116
-
 117
117 -
 118
118 -
 119
119 -
 120
120 -
 121
121 -
 122
122 -
 123
123 -
 124
124 -
 125
125 -
 126
126 -
 127
127 -
 128
128 -
 129
129 -
 130
130 -
 131
131 -
 132
132 -
 133
133 -
 134
134 -
 135
135 -
 136
136 -
 137
137 -
138
-
139
-
140
-
141
-
142
-
143
-
144
-
145
-
146
-
147
-
148
-
149
-
150
-
151
-
152
-
153
-
154
-
155
-
156
-
157
-
158
-
159
-
160
-
161
-
162
-
163
-
164
-
165
-
166
-
167
-
168
-
169
-
170
-
171
-
172
-
173
-
174
-
175
-
176
-
177
-
178
-
179
-
180
-
181
-
182
-
183
-
184
-
185
-
186
-
187
-
188
-
189
-
190
-
191
-
192
-
193
-
194
-
195
-
196
-
197
-
198
-
199
-
200
-
201
-
202
-
203
-
204
-
205
-
206
-
207
-
208
-
209
-
210
-
211
-
212
-
213
-
214
-
215
-
216
-
217
-
218
-
219
-
220
-
221
-
222
-
223
-
224
-
225
-
226
-
227
-
228
-
229
-
230
-
231
-
232
-
233
-
234
-
235
-
236
-
237
-
238
-
239
-
240
-
241
-
242
 |
 |
adidas Group
2011 Annual Report
GROUP MANAGEMENT REPORT – FINANCIAL REVIEW
123
2011
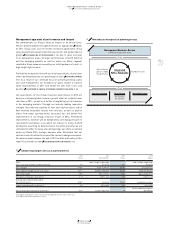
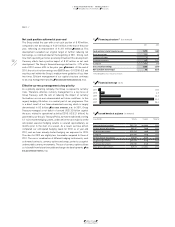
03.2 Group Business Performance Income Statement
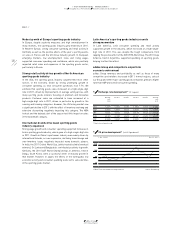
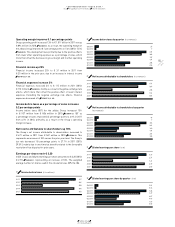
17 Other operating expenses (€ in millions)
2011 5,524
2010 5,046
2009 4,390
2008 4,378
2007 4,115
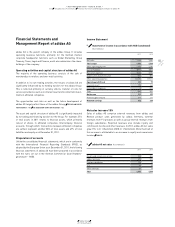
18 Other operating expenses (in % of net sales)
2011 41.4
2010 42.1
2009 42.3
2008 40.5
2007 40.0
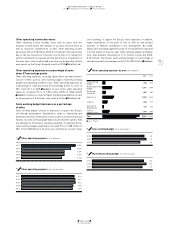
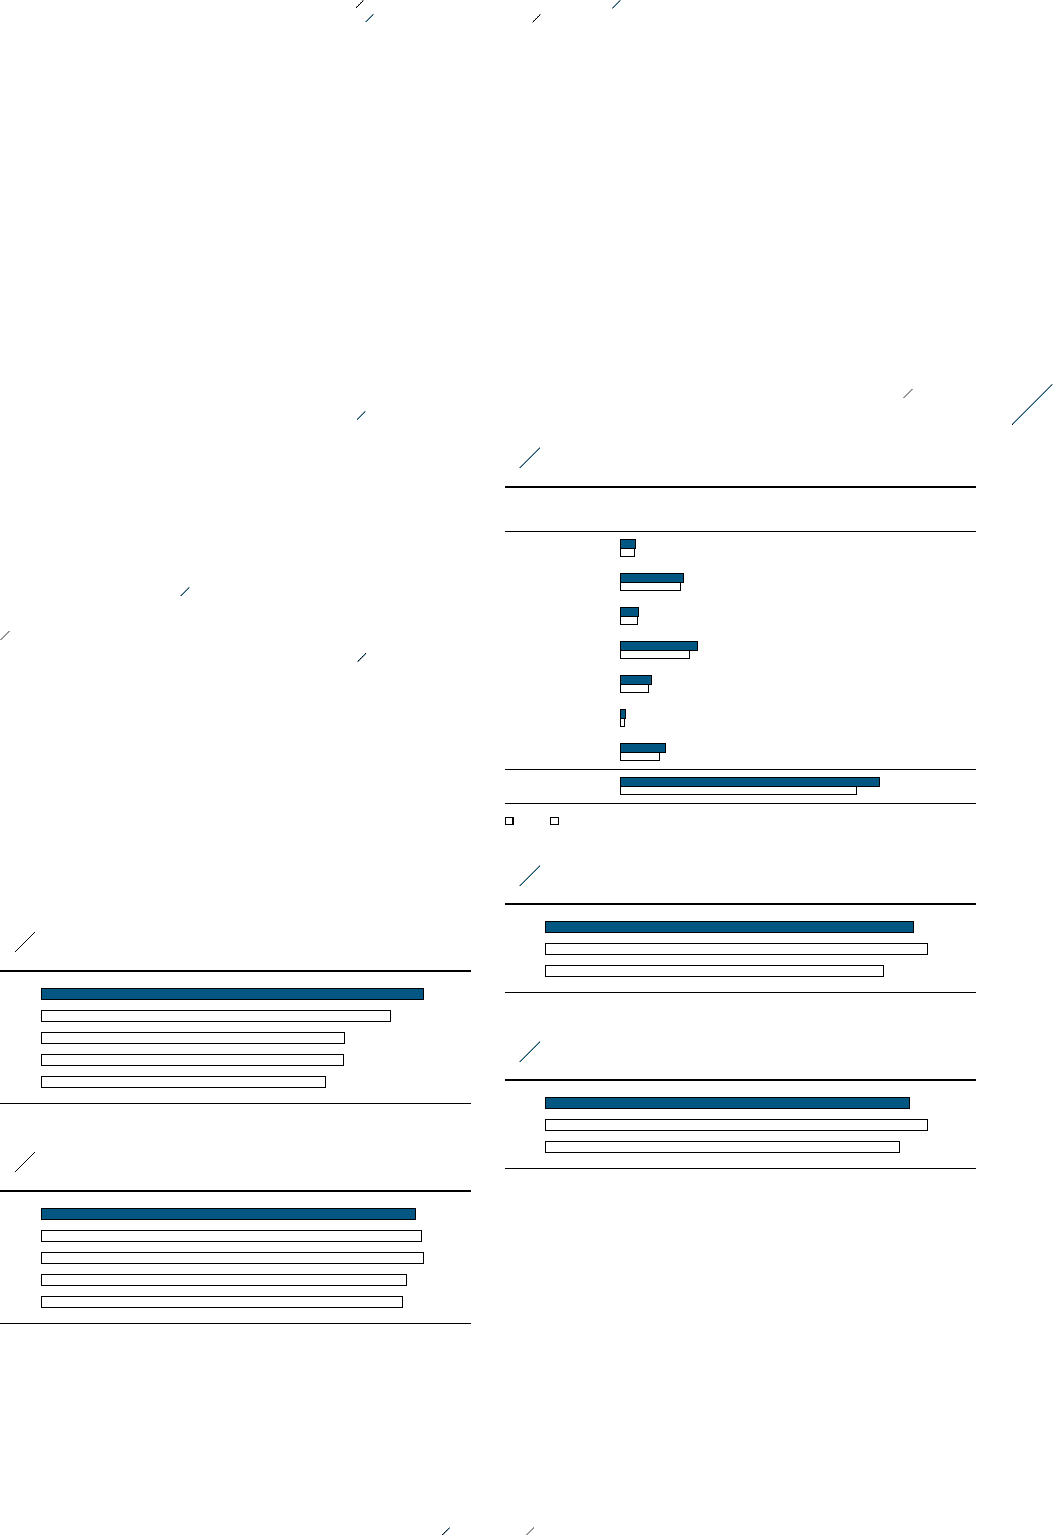
20 Sales working budget (in % of net sales)
2011 2.5
2010 2.6
2009 2.3
21 Marketing working budget (in % of net sales)
2011 10.2
2010 10.7
2009 9.9
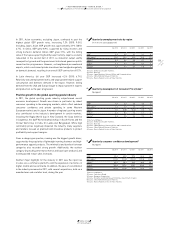
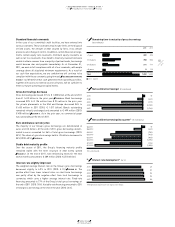
19 Other operating expenses by area (€ in millions)
2011 2010
Sales working
budget 338 308
Marketing working
budget 1,361 1,288
Marketing
overhead 402 380
Sales force 1,653 1,496
Logistics 678 617
Research &
development 115 102
Central
administration 977 855
Total 5,524 5,046
■ 2011 ■ 2010
Other operating income decreases
Other operating income includes items such as gains from the
disposal of fixed assets and releases of accruals and provisions as
well as insurance compensation. In 2011, other operating income
decreased 10% to € 98 million (2010: € 110 million). This was mainly
due to the non-recurrence of positive one-off effects in conjunction
with the settlement of a lawsuit and the divestiture of a trademark in
the prior year, each of which had a positive low-double-digit million
euro impact on the Group’s financial results in 2010
SEE NOTE 29, P. 208
.
Other operating expenses as a percentage of sales
down 0.7 percentage points
Other operating expenses, including depreciation and amortisation,
consist of items such as sales working budget, marketing working
budget and operating overhead costs. Other operating expenses as
a percentage of sales decreased 0.7 percentage points to 41.4% in
2011 from 42.1% in 2010
DIAGRAM 18
. In euro terms, other operating
expenses increased 9% to € 5.524 billion (2010: € 5.046 billion)
DIAGRAM 17
, mainly as a result of higher marketing expenditure as well
as the expansion of the Group’s own-retail activities
SEE NOTE 30, P. 208
.
Sales working budget decreases as a percentage
of sales
Sales working budget consists of expenses to support the Group’s
sell-through development. Expenditures relate to advertising and
promotion initiatives at the point of sale as well as store furniture and
fixtures. As sales working budget expenses are channel-specific, they
are allocated to the Group’s operating segments. In absolute terms,
sales working budget expenditure increased 9% to € 338 million in
2011 from € 308 million in the prior year, primarily as a result of new
store openings to support the Group’s retail expansion. In addition,
higher expenditure at the point of sale as well as new product
launches at Reebok contributed to this development. By brand,
adidas sales working budget decreased 1% to € 243 million compared
to € 245 million in the prior year. Sales working budget for Reebok
more than doubled, amounting to € 51 million at year-end (2010:
€ 25 million). The Group’s sales working budget as a percentage of
sales decreased 0.1 percentage points to 2.5% (2010: 2.6%)
DIAGRAM 20
.