Reebok 2011 Annual Report Download - page 194
Download and view the complete annual report
Please find page 194 of the 2011 Reebok annual report below. You can navigate through the pages in the report by either clicking on the pages listed below, or by using the keyword search tool below to find specific information within the annual report.-
 1
1 -
2
-
3
-
4
-
5
-
6
-
7
-
8
-
9
-
10
-
11
-
12
-
13
-
14
-
15
-
16
-
17
-
18
-
19
-
20
-
21
-
22
-
23
-
24
-
25
-
26
-
27
-
28
-
29
-
30
-
31
-
32
-
33
-
34
-
35
-
36
-
37
-
38
-
39
-
40
-
41
-
42
-
43
-
44
-
45
-
46
-
47
-
48
-
49
-
50
-
51
-
52
-
53
-
54
-
55
-
56
-
57
-
58
-
59
-
60
-
61
-
62
-
63
-
64
-
65
-
66
-
67
-
68
-
69
-
70
-
71
-
72
-
73
-
74
-
75
-
76
-
77
-
78
-
79
-
80
-
81
-
82
-
83
-
84
-
85
-
86
-
87
-
88
-
89
-
90
-
91
-
92
-
93
-
94
-
95
-
96
-
97
-
98
-
99
-
100
-
101
-
102
-
103
-
104
-
105
-
106
-
107
-
108
-
109
-
110
-
111
-
112
-
113
-
114
-
115
-
116
-
117
-
118
-
119
-
120
-
121
-
122
-
123
-
124
-
125
-
126
-
127
-
128
-
129
-
130
-
131
-
132
-
133
-
134
-
135
-
136
-
137
-
138
-
139
-
140
-
141
-
142
-
143
-
144
-
145
-
146
-
147
-
148
-
149
-
150
-
151
-
152
-
153
-
154
-
155
-
156
-
157
-
158
-
159
-
160
-
161
-
162
-
163
-
164
-
165
-
166
-
167
-
168
-
169
-
170
-
171
-
172
-
173
-
174
-
175
-
176
-
177
-
178
-
179
-
180
-
181
-
182
-
183
-
 184
184 -
 185
185 -
 186
186 -
 187
187 -
 188
188 -
 189
189 -
 190
190 -
 191
191 -
 192
192 -
 193
193 -
 194
194 -
 195
195 -
 196
196 -
 197
197 -
 198
198 -
 199
199 -
 200
200 -
 201
201 -
 202
202 -
 203
203 -
 204
204 -
205
-
206
-
207
-
208
-
209
-
210
-
211
-
212
-
213
-
214
-
215
-
216
-
217
-
218
-
219
-
220
-
221
-
222
-
223
-
224
-
225
-
226
-
227
-
228
-
229
-
230
-
231
-
232
-
233
-
234
-
235
-
236
-
237
-
238
-
239
-
240
-
241
-
242
 |
 |

adidas Group
2011 Annual Report
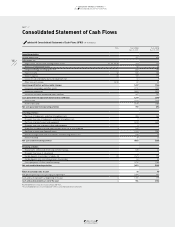
CONSOLIDATED FINANCIAL STATEMENTS
190
2011
190
2011
04.8
04.8 Notes Notes to the Consolidated Statement of Financial Position
08 Inventories
Inventories by major classification are as follows:
Inventories (€ in millions)
Dec. 31, 2011 Dec. 31, 2010
Gross value Allowance for
obsolescence
Net value Gross value Allowance for
obsolescence
Net value
Merchandise and finished goods on hand 1,782 80 1,702 1,538 96 1,442
Goods in transit 746 – 746 641 – 641
Raw materials 28 1 27 23 1 22
Work in progress 7 – 7 14 – 14
Inventories 2,563 81 2,482 2,216 97 2,119
Goods in transit mainly relate to shipments of finished goods and
merchandise from suppliers in Asia to subsidiaries in Europe, Asia
and the Americas. The carrying amount of inventories which are
measured at fair value less costs to sell amounts to € 127 million
and € 195 million as at December 31, 2011 and 2010, respectively
SEE NOTE 02
.
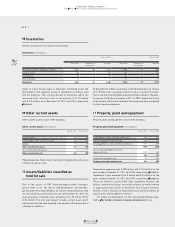
09 Other current assets
Other current assets consist of the following:
Other current assets (€ in millions)
Dec. 31, 2011 Dec. 31, 2010
Prepaid expenses 232 200
Tax receivables other than income taxes 151 122
Sundry 88 70
Other current assets, gross 471 392
Less: accumulated allowances 2 2
Other current assets, net 469 390
Prepaid expenses relate mainly to promotion agreements and service
contracts as well as rents.
10 Assets/liabilities classified as
held for sale
Part of the assets of GEV Grundstücksgesellschaft Herzogen-
aurach mbH & Co. KG and of Immobilieninvest und Betriebs-
gesellschaft Herzo-Base GmbH & Co. KG are still presented as held
for sale following concrete plans for sale. At December 31, 2011, the
disposal groups contained assets amounting to € 25 million (2010:
€ 30 million). The prior year amount includes certain assets which
have been reclassified and impaired in an amount of € 5 million due to
a change in conditions.
At December 31, 2010, a warehouse in the Netherlands in an amount
of € 17 million was classified as held for sale as a result of the inten-
tion to sell and an existing Memorandum of Understanding. The ware-
house was sold in the first quarter of 2011. In 2010, impairment losses
in the amount of € 6 million related to this warehouse were recognised
in other operating expenses.
11 Property, plant and equipment
Property, plant and equipment consist of the following:
Property, plant and equipment (€ in millions)
Dec. 31, 2011 Dec. 31, 2010
Land, buildings and leasehold improvements 674 510
Technical equipment and machinery 180 161
Other equipment as well as furniture and fixtures 1,131 987
1,985 1,658
Less: accumulated depreciation and
impairment losses 1,107 943
878 715
Construction in progress, net 85 140
Property, plant and equipment, net 963 855
Depreciation expenses were € 205 million and € 194 million for the
years ending December 31, 2011 and 2010, respectively
SEE NOTE 30
.
Impairment losses amounted to € 0 million and € 10 million for the
years ending December 31, 2011 and 2010, respectively
SEE NOTE 30
.
These are related to assets within other equipment, furniture and
fixtures, mainly in the Group’s own-retail activities, for which contrary
to expectations there will be an insufficient flow of future economic
benefits. In 2011, reversals of impairment losses were recorded in an
amount of € 1 million (2010: € 7 million).
For details see Attachment I to the consolidated financial state-
ments
SEE STATEMENT OF MOVEMENTS OF INTANGIBLE AND TANGIBLE ASSETS, P. 216
.