Reebok 2011 Annual Report Download - page 161
Download and view the complete annual report
Please find page 161 of the 2011 Reebok annual report below. You can navigate through the pages in the report by either clicking on the pages listed below, or by using the keyword search tool below to find specific information within the annual report.-
 1
1 -
2
-
3
-
4
-
5
-
6
-
7
-
8
-
9
-
10
-
11
-
12
-
13
-
14
-
15
-
16
-
17
-
18
-
19
-
20
-
21
-
22
-
23
-
24
-
25
-
26
-
27
-
28
-
29
-
30
-
31
-
32
-
33
-
34
-
35
-
36
-
37
-
38
-
39
-
40
-
41
-
42
-
43
-
44
-
45
-
46
-
47
-
48
-
49
-
50
-
51
-
52
-
53
-
54
-
55
-
56
-
57
-
58
-
59
-
60
-
61
-
62
-
63
-
64
-
65
-
66
-
67
-
68
-
69
-
70
-
71
-
72
-
73
-
74
-
75
-
76
-
77
-
78
-
79
-
80
-
81
-
82
-
83
-
84
-
85
-
86
-
87
-
88
-
89
-
90
-
91
-
92
-
93
-
94
-
95
-
96
-
97
-
98
-
99
-
100
-
101
-
102
-
103
-
104
-
105
-
106
-
107
-
108
-
109
-
110
-
111
-
112
-
113
-
114
-
115
-
116
-
117
-
118
-
119
-
120
-
121
-
122
-
123
-
124
-
125
-
126
-
127
-
128
-
129
-
130
-
131
-
132
-
133
-
134
-
135
-
136
-
137
-
138
-
139
-
140
-
141
-
142
-
143
-
144
-
145
-
146
-
147
-
148
-
149
-
150
-
 151
151 -
 152
152 -
 153
153 -
 154
154 -
 155
155 -
 156
156 -
 157
157 -
 158
158 -
 159
159 -
 160
160 -
 161
161 -
 162
162 -
 163
163 -
 164
164 -
 165
165 -
 166
166 -
 167
167 -
 168
168 -
 169
169 -
 170
170 -
 171
171 -
172
-
173
-
174
-
175
-
176
-
177
-
178
-
179
-
180
-
181
-
182
-
183
-
184
-
185
-
186
-
187
-
188
-
189
-
190
-
191
-
192
-
193
-
194
-
195
-
196
-
197
-
198
-
199
-
200
-
201
-
202
-
203
-
204
-
205
-
206
-
207
-
208
-
209
-
210
-
211
-
212
-
213
-
214
-
215
-
216
-
217
-
218
-
219
-
220
-
221
-
222
-
223
-
224
-
225
-
226
-
227
-
228
-
229
-
230
-
231
-
232
-
233
-
234
-
235
-
236
-
237
-
238
-
239
-
240
-
241
-
242
 |
 |

adidas Group
2011 Annual Report
GROUP MANAGEMENT REPORT – FINANCIAL REVIEW
157
2011
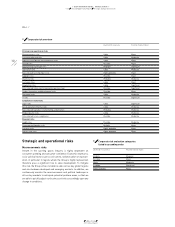
03.4 Risk and Opportunity Report Financial risks
Utilising a centralised currency risk management system, our Group
hedges currency needs for projected sourcing requirements on a
rolling 12- to 24-month basis
SEE TREASURY, P. 129
. Our goal is to have
the vast majority of our hedging volume secured six months prior to
the start of a given season. In rare instances, hedges are contracted
beyond the 24-month horizon. The Group also largely hedges balance
sheet risks. Due to our strong global position, we are able to minimise
currency risk to a large extent by utilising natural hedges.
Nevertheless, our net US dollar cash flow exposure after natural
hedges calculated for 2012 was roughly € 3.9 billion at year-end
2011, which we hedged using forward contracts, currency options
and currency swaps
TABLE 05
. Our Group’s Treasury Policy allows us
to utilise hedging instruments, such as currency options or option
combinations, which provide protection from negative exchange
rate fluctuations while – at the same time – retaining the potential
to benefit from future favourable exchange rate developments in the
financial markets.
As 2012 hedging has almost been completed, it is clear that conversion
rates on major currencies will be slightly less favourable compared to
those of 2011. Volume forecast variances, greater currency volatility
and an increasing portion of our business in emerging markets will
expose the adidas Group to additional currency risks in 2012. As a
consequence, our assessment of currency risks remains unchanged.
We believe the likelihood of currency risks is highly probable and we
regard the possible financial impact of currency risks as major.
Interest rate risks
Changes in global market interest rates affect future interest payments
for variable-interest liabilities. As a result, significant interest rate
increases can have an adverse effect on the Group’s profitability,
liquidity and financial position.
In line with IFRS 7 requirements, we have analysed the impact of
changes in the Group’s most important interest rates on net income
and shareholders’ equity. The effect of interest rate changes on future
cash flows is excluded from this analysis. Nevertheless, accrued
interest, which is recognised as a liability, has been re-calculated based
on the hypothetical market interest rates as at December 31, 2011.
Fair values for derivative interest rate instruments accounted for as
cash flow hedges were then re-evaluated based on the hypothetical
market interest rates with the resulting effects on net income and
equity included in the sensitivity analysis.
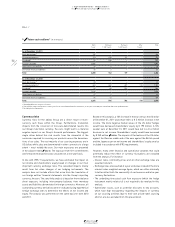
05 Exposure to foreign exchange risk 1)
(based on notional amounts, € in millions)
USD RUB GBP JPY
As at December 31, 2011
Exposure from firm commitments
and forecasted transactions (3,859) 298 330 331
Balance sheet exposure including
intercompany exposure (140) 83 2 30
Total gross exposure (3,999) 381 332 361
Hedged with other cash flows 93 – – –
Hedged with currency options 365 – (11) –
Hedged with forward contracts 2,298 (47) (194) (145)
Net exposure (1,243) 334 127 216
As at December 31, 2010
Exposure from firm commitments
and forecasted transactions (3,313) 380 332 325
Balance sheet exposure including
intercompany exposure (194) 13 (10) 25
Total gross exposure (3.507) 393 322 350
Hedged with other cash flows 166 – – –
Hedged with currency options 576 – (41) –
Hedged with forward contracts 1,733 – (222) (266)
Net exposure (1,032) 393 59 84
1) Rounding difference may arise in totals.
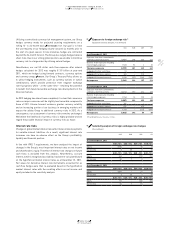
06 Sensitivity analysis of foreign exchange rate changes
(€ in millions)
USD RUB GBP JPY
As at December 31, 2011
EUR +10% USD +10% EUR +10% EUR +10%
Equity (195) – 15 11
Net income 5 (9) 0 (3)
EUR – 10% USD – 10% EUR – 10% EUR – 10%
Equity 243 – (19) (13)
Net income (6) 7 0 4
As at December 31, 2010
EUR +10% USD +10% EUR +10% EUR +10%
Equity (157) – 21 20
Net income 3 (1) 1 (3)
EUR – 10% USD – 10% EUR – 10% EUR – 10%
Equity 193 – (25) (24)
Net income (4) 1 (1) 4