Reebok 2011 Annual Report Download - page 190
Download and view the complete annual report
Please find page 190 of the 2011 Reebok annual report below. You can navigate through the pages in the report by either clicking on the pages listed below, or by using the keyword search tool below to find specific information within the annual report.-
 1
1 -
2
-
3
-
4
-
5
-
6
-
7
-
8
-
9
-
10
-
11
-
12
-
13
-
14
-
15
-
16
-
17
-
18
-
19
-
20
-
21
-
22
-
23
-
24
-
25
-
26
-
27
-
28
-
29
-
30
-
31
-
32
-
33
-
34
-
35
-
36
-
37
-
38
-
39
-
40
-
41
-
42
-
43
-
44
-
45
-
46
-
47
-
48
-
49
-
50
-
51
-
52
-
53
-
54
-
55
-
56
-
57
-
58
-
59
-
60
-
61
-
62
-
63
-
64
-
65
-
66
-
67
-
68
-
69
-
70
-
71
-
72
-
73
-
74
-
75
-
76
-
77
-
78
-
79
-
80
-
81
-
82
-
83
-
84
-
85
-
86
-
87
-
88
-
89
-
90
-
91
-
92
-
93
-
94
-
95
-
96
-
97
-
98
-
99
-
100
-
101
-
102
-
103
-
104
-
105
-
106
-
107
-
108
-
109
-
110
-
111
-
112
-
113
-
114
-
115
-
116
-
117
-
118
-
119
-
120
-
121
-
122
-
123
-
124
-
125
-
126
-
127
-
128
-
129
-
130
-
131
-
132
-
133
-
134
-
135
-
136
-
137
-
138
-
139
-
140
-
141
-
142
-
143
-
144
-
145
-
146
-
147
-
148
-
149
-
150
-
151
-
152
-
153
-
154
-
155
-
156
-
157
-
158
-
159
-
160
-
161
-
162
-
163
-
164
-
165
-
166
-
167
-
168
-
169
-
170
-
171
-
172
-
173
-
174
-
175
-
176
-
177
-
178
-
179
-
 180
180 -
 181
181 -
 182
182 -
 183
183 -
 184
184 -
 185
185 -
 186
186 -
 187
187 -
 188
188 -
 189
189 -
 190
190 -
 191
191 -
 192
192 -
 193
193 -
 194
194 -
 195
195 -
 196
196 -
 197
197 -
 198
198 -
 199
199 -
 200
200 -
201
-
202
-
203
-
204
-
205
-
206
-
207
-
208
-
209
-
210
-
211
-
212
-
213
-
214
-
215
-
216
-
217
-
218
-
219
-
220
-
221
-
222
-
223
-
224
-
225
-
226
-
227
-
228
-
229
-
230
-
231
-
232
-
233
-
234
-
235
-
236
-
237
-
238
-
239
-
240
-
241
-
242
 |
 |

adidas Group
2011 Annual Report
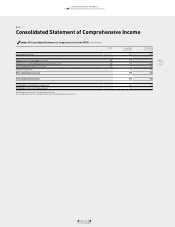
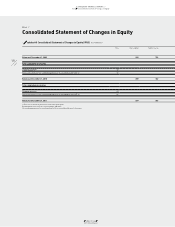
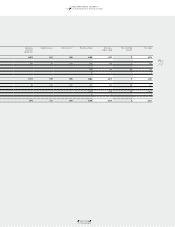
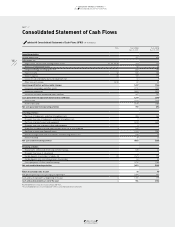
CONSOLIDATED FINANCIAL STATEMENTS
04.8 Notes
186
2011
186
2011
04.8
Discount rates are based on a weighted average cost of capital calcu-
lation considering a five-year average market-weighted debt/equity
structure and financing costs referencing the Group’s major competi-
tors for each cash-generating unit (or groups of units). The discount
rates used are after-tax rates and reflect the specific equity and
country risk of the relevant cash-generating unit.
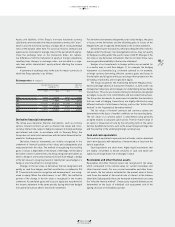
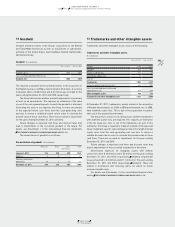
The carrying amounts of acquired goodwill as well as of intangible
assets allocated to the respective groups of cash-generating units and
the respective discount rates applied to the cash flow projections are
as follows:
Allocation of goodwill
Goodwill
(€ in millions)
Intangible
assets with
indefinite
useful lives
(€ in millions)
Discount
rate
Wholesale 940 816 7.0 – 10.5%
Retail 234 390 7.0 – 10.5%
Other Businesses 406 297 6.5 – 7.5%
Total 1,580 1,503
The goodwill shown in the table under Wholesale, Retail and Other Busi-
nesses is an aggregation of several cash-generating units. The cash-
generating units with the highest goodwill of the respective segment
are Greater China (€ 162 million), Central Europe (€ 155 million),
Northern Europe (€ 134 million) and North America (€ 105 million)
within the Wholesale segment as well as CIS (€ 79 million), North
America (€ 30 million) and Central Europe (€ 29 million) within the
Retail segment. In the Other Businesses segment, the most signifi-
cant goodwill amount represents the TaylorMade-adidas Golf segment
goodwill in an amount of € 284 million.
Research and development
Research costs are expensed in full as incurred. Development costs
are also expensed as incurred if they do not meet the recognition
criteria of IAS 38 “Intangible Assets”.
The Group spent € 115 million and € 102 million on product
research and development for the years ending December 31, 2011
and 2010, respectively.
Financial assets
All purchases and sales of financial assets are recognised on the
trade date. Costs of purchases include transaction costs. If the fair
value of available-for-sale financial assets (i.e. non-derivative finan-
cial assets which are not allocable under another category of IAS 39)
can be measured reliably, they are subsequently carried at fair value.
Realised and unrealised gains and losses arising from changes in the
fair value of financial assets are included in the income statement for
the period in which they arise, except for available-for-sale financial
assets where unrealised gains and losses are recognised in equity
unless they are impaired.
Borrowings and other liabilities
Borrowings and other liabilities are recognised at fair value using
the “effective interest method”, net of transaction costs incurred. In
subsequent periods, long-term borrowings are stated at amortised
cost using the “effective interest method”. Any difference between
proceeds (net of transaction costs) and the redemption value is recog-
nised in the income statement over the term of the borrowing.
Other provisions and accrued liabilities
Other provisions are recognised where a present obligation (legal or
constructive) to third parties has been incurred as a result of a past
event which can be estimated reliably and is likely to lead to an outflow
of resources, and where the timing or amount is uncertain. Other
non-current provisions are discounted if the effect of discounting is
material.
Accrued liabilities are liabilities to pay for goods or services
that have been received or supplied but have not been paid, invoiced
or formally agreed with the supplier, including amounts due to
employees. Here, however, the timing and amount of an outflow of
resources is not uncertain.