Reebok 2011 Annual Report Download - page 129
Download and view the complete annual report
Please find page 129 of the 2011 Reebok annual report below. You can navigate through the pages in the report by either clicking on the pages listed below, or by using the keyword search tool below to find specific information within the annual report.-
 1
1 -
2
-
3
-
4
-
5
-
6
-
7
-
8
-
9
-
10
-
11
-
12
-
13
-
14
-
15
-
16
-
17
-
18
-
19
-
20
-
21
-
22
-
23
-
24
-
25
-
26
-
27
-
28
-
29
-
30
-
31
-
32
-
33
-
34
-
35
-
36
-
37
-
38
-
39
-
40
-
41
-
42
-
43
-
44
-
45
-
46
-
47
-
48
-
49
-
50
-
51
-
52
-
53
-
54
-
55
-
56
-
57
-
58
-
59
-
60
-
61
-
62
-
63
-
64
-
65
-
66
-
67
-
68
-
69
-
70
-
71
-
72
-
73
-
74
-
75
-
76
-
77
-
78
-
79
-
80
-
81
-
82
-
83
-
84
-
85
-
86
-
87
-
88
-
89
-
90
-
91
-
92
-
93
-
94
-
95
-
96
-
97
-
98
-
99
-
100
-
101
-
102
-
103
-
104
-
105
-
106
-
107
-
108
-
109
-
110
-
111
-
112
-
113
-
114
-
115
-
116
-
117
-
118
-
 119
119 -
 120
120 -
 121
121 -
 122
122 -
 123
123 -
 124
124 -
 125
125 -
 126
126 -
 127
127 -
 128
128 -
 129
129 -
 130
130 -
 131
131 -
 132
132 -
 133
133 -
 134
134 -
 135
135 -
 136
136 -
 137
137 -
 138
138 -
 139
139 -
140
-
141
-
142
-
143
-
144
-
145
-
146
-
147
-
148
-
149
-
150
-
151
-
152
-
153
-
154
-
155
-
156
-
157
-
158
-
159
-
160
-
161
-
162
-
163
-
164
-
165
-
166
-
167
-
168
-
169
-
170
-
171
-
172
-
173
-
174
-
175
-
176
-
177
-
178
-
179
-
180
-
181
-
182
-
183
-
184
-
185
-
186
-
187
-
188
-
189
-
190
-
191
-
192
-
193
-
194
-
195
-
196
-
197
-
198
-
199
-
200
-
201
-
202
-
203
-
204
-
205
-
206
-
207
-
208
-
209
-
210
-
211
-
212
-
213
-
214
-
215
-
216
-
217
-
218
-
219
-
220
-
221
-
222
-
223
-
224
-
225
-
226
-
227
-
228
-
229
-
230
-
231
-
232
-
233
-
234
-
235
-
236
-
237
-
238
-
239
-
240
-
241
-
242
 |
 |

adidas Group
2011 Annual Report
GROUP MANAGEMENT REPORT – FINANCIAL REVIEW
125
2011
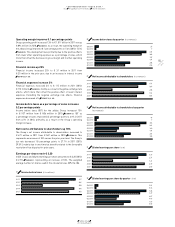
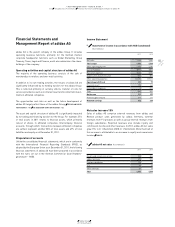
Operating margin improves 0.1 percentage points
Group operating profit increased 13% to € 1.011 billion in 2011 versus
€ 894 million in 2010
DIAGRAM 23
. As a result, the operating margin of
the adidas Group improved 0.1 percentage points to 7.6% (2010: 7.5%)
DIAGRAM 25
. This development was primarily due to the positive effects
from lower other operating expenses as a percentage of sales, which
more than offset the decrease in gross margin and in other operating
income.
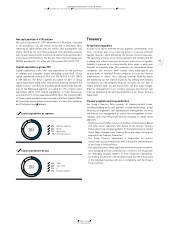
Financial income up 25%
Financial income increased 25% to € 31 million in 2011 from
€ 25 million in the prior year, due to an increase in interest income
SEE NOTE 32, P. 209
.
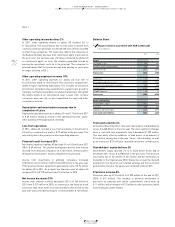
Financial expenses increase 2%
Financial expenses increased 2% to € 115 million in 2011 (2010:
€ 113 million)
DIAGRAM 26
, mainly as a result of negative exchange rate
effects, which more than offset the positive effect of lower interest
expenses. Excluding the negative exchange rate effects, financial
expenses decreased 4%
SEE NOTE 32, P. 209
.
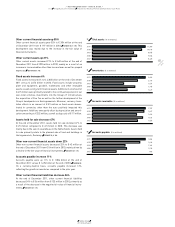
Income before taxes as a percentage of sales increases
0.2 percentage points
Income before taxes (IBT) for the adidas Group increased 15%
to € 927 million from € 806 million in 2010
DIAGRAM 27
. IBT as
a percentage of sales improved 0.2 percentage points to 6.9% in 2011
from 6.7% in 2010, primarily as a result of the Group’s operating
margin increase.
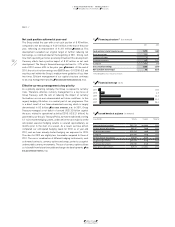
Net income attributable to shareholders up 18%
The Group’s net income attributable to shareholders increased to
€ 671 million in 2011 from € 567 million in 2010
DIAGRAM 29
. This
represents an increase of 18% versus the prior year level. The Group’s
tax rate decreased 1.8 percentage points to 27.7% in 2011 (2010:
29.5%), mainly due to one-time tax benefits related to the favourable
resolution of tax disputes for prior years.
Earnings per share reach € 3.20
In 2011, basic and diluted earnings per share amounted to € 3.20 (2010:
€ 2.71)
DIAGRAM 31
, representing an increase of 18%. The weighted
average number of shares used in the calculation was 209,216,186.
03.2 Group Business Performance Income Statement
27 Income before taxes (€ in millions)
2011 927
2010 806
2009 358
2008 904
2007 815
29 Net income attributable to shareholders (€ in millions)
2011 671
2010 567
2009 245
2008 642
2007 551
31 Diluted earnings per share (in €)
2011 3.20
2010 2.71
2009 1.22
2008 3.07
2007 2.57
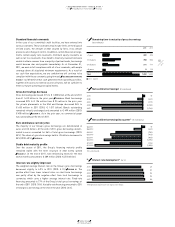
28 Income before taxes by quarter (€ in millions)
Q4 2011 27
Q4 2010 7
Q3 2011 418
Q3 2010 380
Q2 2011 197
Q2 2010 176
Q1 2011 285
Q1 2010 243
30 Net income attributable to shareholders by quarter
(€ in millions)
Q4 2011 18
Q4 2010 7
Q3 2011 303
Q3 2010 266
Q2 2011 140
Q2 2010 126
Q1 2011 209
Q1 2010 168
32 Diluted earnings per share by quarter (in €)
Q4 2011 0.09
Q4 2010 0.03
Q3 2011 1.45
Q3 2010 1.27
Q2 2011 0.67
Q2 2010 0.60
Q1 2011 1.00
Q1 2010 0.80