Reebok 2011 Annual Report Download - page 128
Download and view the complete annual report
Please find page 128 of the 2011 Reebok annual report below. You can navigate through the pages in the report by either clicking on the pages listed below, or by using the keyword search tool below to find specific information within the annual report.-
 1
1 -
2
-
3
-
4
-
5
-
6
-
7
-
8
-
9
-
10
-
11
-
12
-
13
-
14
-
15
-
16
-
17
-
18
-
19
-
20
-
21
-
22
-
23
-
24
-
25
-
26
-
27
-
28
-
29
-
30
-
31
-
32
-
33
-
34
-
35
-
36
-
37
-
38
-
39
-
40
-
41
-
42
-
43
-
44
-
45
-
46
-
47
-
48
-
49
-
50
-
51
-
52
-
53
-
54
-
55
-
56
-
57
-
58
-
59
-
60
-
61
-
62
-
63
-
64
-
65
-
66
-
67
-
68
-
69
-
70
-
71
-
72
-
73
-
74
-
75
-
76
-
77
-
78
-
79
-
80
-
81
-
82
-
83
-
84
-
85
-
86
-
87
-
88
-
89
-
90
-
91
-
92
-
93
-
94
-
95
-
96
-
97
-
98
-
99
-
100
-
101
-
102
-
103
-
104
-
105
-
106
-
107
-
108
-
109
-
110
-
111
-
112
-
113
-
114
-
115
-
116
-
117
-
 118
118 -
 119
119 -
 120
120 -
 121
121 -
 122
122 -
 123
123 -
 124
124 -
 125
125 -
 126
126 -
 127
127 -
 128
128 -
 129
129 -
 130
130 -
 131
131 -
 132
132 -
 133
133 -
 134
134 -
 135
135 -
 136
136 -
 137
137 -
 138
138 -
139
-
140
-
141
-
142
-
143
-
144
-
145
-
146
-
147
-
148
-
149
-
150
-
151
-
152
-
153
-
154
-
155
-
156
-
157
-
158
-
159
-
160
-
161
-
162
-
163
-
164
-
165
-
166
-
167
-
168
-
169
-
170
-
171
-
172
-
173
-
174
-
175
-
176
-
177
-
178
-
179
-
180
-
181
-
182
-
183
-
184
-
185
-
186
-
187
-
188
-
189
-
190
-
191
-
192
-
193
-
194
-
195
-
196
-
197
-
198
-
199
-
200
-
201
-
202
-
203
-
204
-
205
-
206
-
207
-
208
-
209
-
210
-
211
-
212
-
213
-
214
-
215
-
216
-
217
-
218
-
219
-
220
-
221
-
222
-
223
-
224
-
225
-
226
-
227
-
228
-
229
-
230
-
231
-
232
-
233
-
234
-
235
-
236
-
237
-
238
-
239
-
240
-
241
-
242
 |
 |

adidas Group
2011 Annual Report
GROUP MANAGEMENT REPORT – FINANCIAL REVIEW
124
2011
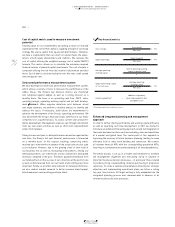
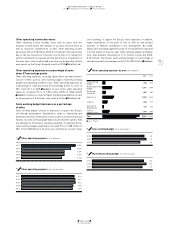
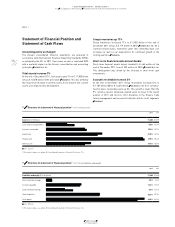
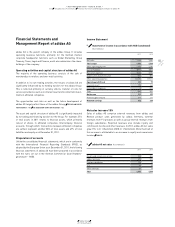
03.2 Group Business Performance Income Statement
03.2
22 EBITDA (€ in millions)
2011 1,257
2010 1,159
2009 780
2008 1,280
2007 1,165
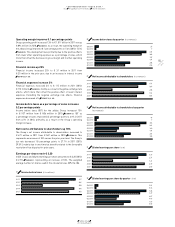
23 Operating profit (€ in millions)
2011 1,011
2010 894
2009 508
2008 1,070
2007 949
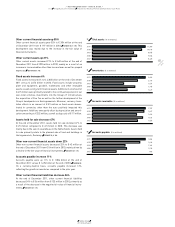
25 Operating margin (in %)
2011 7.6
2010 7.5
2009 4.9
2008 9.9
2007 9.2
26 Financial expenses (€ in millions)
2011 115
2010 113
2009 169
2008 203
2007 170
24 Operating profit by quarter (€ in millions)
Q4 2011 38
Q4 2010 28
Q3 2011 441
Q3 2010 411
Q2 2011 219
Q2 2010 195
Q1 2011 313
Q1 2010 260
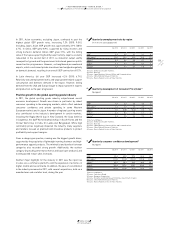
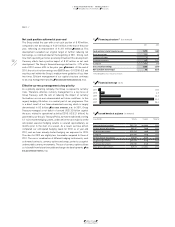
Marketing working budget down as a percentage
of sales
Marketing working budget consists of items such as expenses for
promotion partnerships, advertising and public relations to support
brand strength. As marketing working budget expenses are not
distribution channel specific, they are not allocated to the segments.
In absolute terms, marketing working budget increased 6% to
€ 1.361 billion in 2011 from € 1.288 billion in the prior year. This was
mainly due to higher expenditures at the adidas brand related to the
launch of the “all adidas” campaign. In addition, increased marketing
and promotion initiatives for new product concepts impacted this
development. By brand, the adidas marketing working budget
increased 9% to € 1.007 billion from € 927 million in 2010. Marketing
working budget of the Reebok brand was down 5% to € 235 million
(2010: € 247 million). The Group’s marketing working budget as
a percentage of sales decreased 0.5 percentage points to 10.2% (2010:
10.7%)
DIAGRAM 21
.
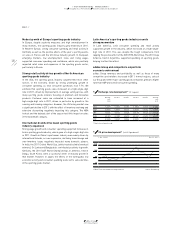
Operating overhead expenses decrease as a percentage
of sales
Group operating overheads include overhead costs related to
marketing, logistics, sales and R&D as well as central adminis-
tration. Almost half of the operating overhead expenses are related
to personnel costs. In absolute terms, operating overhead expenses
were up 11% to € 3.825 billion in 2011 versus € 3.450 billion in 2010.
This was primarily a result of the expansion of the Group’s own-retail
activities, as well as an increase in logistic and warehouse costs.
However, due to increasing retail sophistication as well as operational
leverage, operating overhead expenses as a percentage of sales
decreased 0.1 percentage points to 28.7% from 28.8% in the prior year.
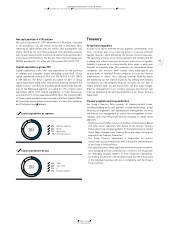
Number of Group employees up 10%
At the end of December 2011, the Group employed 46,824 people.
This represents an increase of 10% versus the prior year level of
42,541. New hirings related to the expansion of the Group’s own-retail
store base were the main driver of this development. On a full-time
equivalent basis, the number of employees increased 12% to 40,637 at
the end of 2011 (2010: 36,444)
SEE EMPLOYEES, P. 101
.
EBITDA grows 8%
The Group’s earnings before interest, taxes, depreciation and
amortisation as well as impairment/reversal of impairment losses
on property, plant and equipment and intangible assets (EBITDA)
increased 8% to € 1.257 billion in 2011 (2010: € 1.159 billion)
DIAGRAM 22
. Depreciation and amortisation expense for tangible and
intangible assets with limited useful lives declined 4% to € 252 million
in 2011 (2010: € 263 million). This development was mainly a result
of lower impairment charges in 2011 compared to the prior year. In
accordance with IFRS, intangible assets with indefinite useful lives
(goodwill and trademarks) are tested annually and additionally when
there are indications of potential impairment. In this connection,
no impairment of intangible assets with unlimited useful lives was
incurred in 2011 and 2010.