Reebok 2011 Annual Report Download - page 143
Download and view the complete annual report
Please find page 143 of the 2011 Reebok annual report below. You can navigate through the pages in the report by either clicking on the pages listed below, or by using the keyword search tool below to find specific information within the annual report.-
 1
1 -
2
-
3
-
4
-
5
-
6
-
7
-
8
-
9
-
10
-
11
-
12
-
13
-
14
-
15
-
16
-
17
-
18
-
19
-
20
-
21
-
22
-
23
-
24
-
25
-
26
-
27
-
28
-
29
-
30
-
31
-
32
-
33
-
34
-
35
-
36
-
37
-
38
-
39
-
40
-
41
-
42
-
43
-
44
-
45
-
46
-
47
-
48
-
49
-
50
-
51
-
52
-
53
-
54
-
55
-
56
-
57
-
58
-
59
-
60
-
61
-
62
-
63
-
64
-
65
-
66
-
67
-
68
-
69
-
70
-
71
-
72
-
73
-
74
-
75
-
76
-
77
-
78
-
79
-
80
-
81
-
82
-
83
-
84
-
85
-
86
-
87
-
88
-
89
-
90
-
91
-
92
-
93
-
94
-
95
-
96
-
97
-
98
-
99
-
100
-
101
-
102
-
103
-
104
-
105
-
106
-
107
-
108
-
109
-
110
-
111
-
112
-
113
-
114
-
115
-
116
-
117
-
118
-
119
-
120
-
121
-
122
-
123
-
124
-
125
-
126
-
127
-
128
-
129
-
130
-
131
-
132
-
 133
133 -
 134
134 -
 135
135 -
 136
136 -
 137
137 -
 138
138 -
 139
139 -
 140
140 -
 141
141 -
 142
142 -
 143
143 -
 144
144 -
 145
145 -
 146
146 -
 147
147 -
 148
148 -
 149
149 -
 150
150 -
 151
151 -
 152
152 -
 153
153 -
154
-
155
-
156
-
157
-
158
-
159
-
160
-
161
-
162
-
163
-
164
-
165
-
166
-
167
-
168
-
169
-
170
-
171
-
172
-
173
-
174
-
175
-
176
-
177
-
178
-
179
-
180
-
181
-
182
-
183
-
184
-
185
-
186
-
187
-
188
-
189
-
190
-
191
-
192
-
193
-
194
-
195
-
196
-
197
-
198
-
199
-
200
-
201
-
202
-
203
-
204
-
205
-
206
-
207
-
208
-
209
-
210
-
211
-
212
-
213
-
214
-
215
-
216
-
217
-
218
-
219
-
220
-
221
-
222
-
223
-
224
-
225
-
226
-
227
-
228
-
229
-
230
-
231
-
232
-
233
-
234
-
235
-
236
-
237
-
238
-
239
-
240
-
241
-
242
 |
 |
adidas Group
2011 Annual Report
GROUP MANAGEMENT REPORT – FINANCIAL REVIEW
139
2011
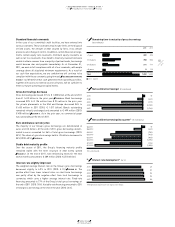
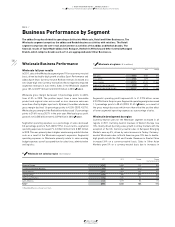
03.3 Business Performance by Segment Wholesale Business Performance
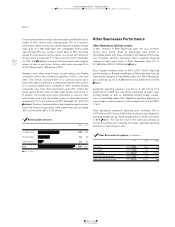
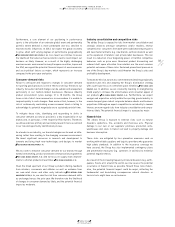
05 Wholesale net sales by quarter (€ in millions)
Q4 2011 2,102
Q4 2010 1,934
Q3 2011 2,577
Q3 2010 2,421
Q2 2011 1,973
Q2 2010 1,928
Q1 2011 2,320
Q1 2010 1,898
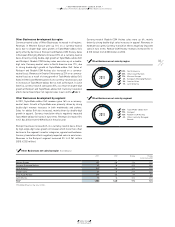
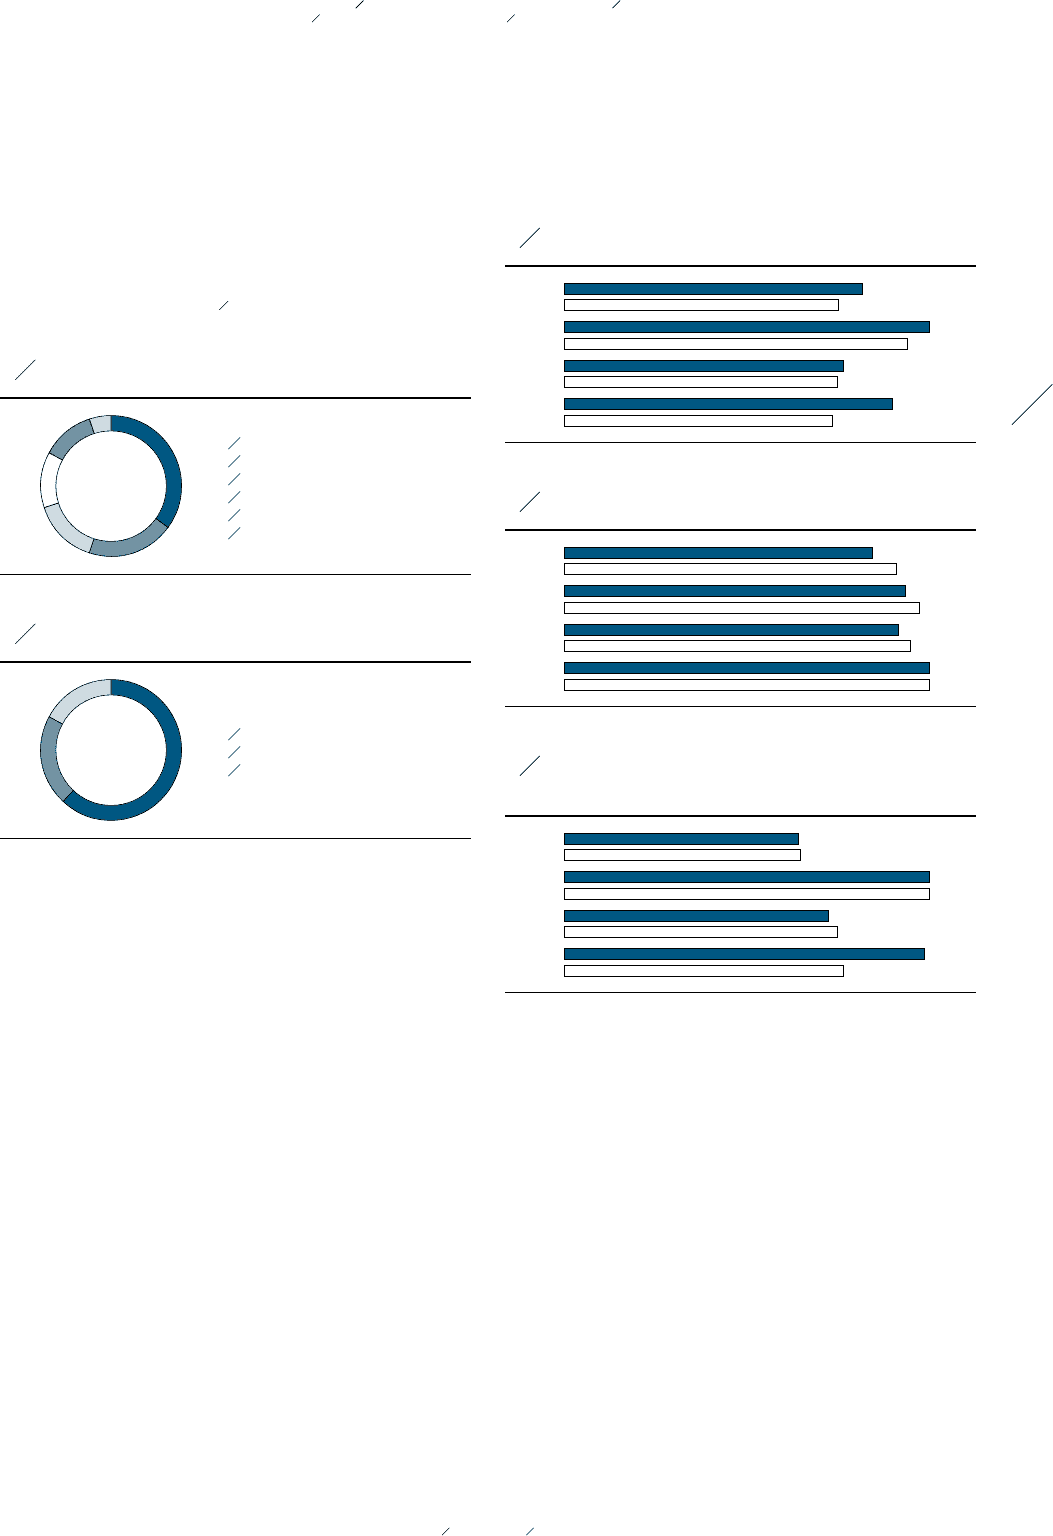
06 Wholesale gross margin by quarter (in %)
Q4 2011 36.4
Q4 2010 39.1
Q3 2011 40.4
Q3 2010 41.9
Q2 2011 39.5
Q2 2010 41.0
Q1 2011 43.1
Q1 2010 43.1
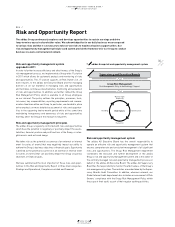
07 Wholesale segmental operating profit by quarter
(€ in millions)
Q4 2011 523
Q4 2010 525
Q3 2011 813
Q3 2010 813
Q2 2011 586
Q2 2010 607
Q1 2011 802
Q1 2010 626
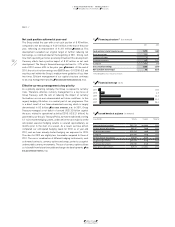
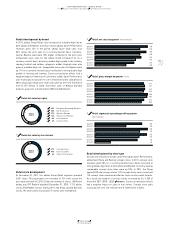
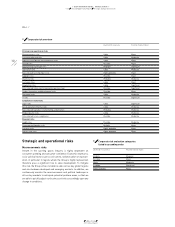
04 Wholesale net sales by brand
2011 1 62% adidas Sport Performance
2 21% adidas Sport Style
3 17% Reebok
1
2
3
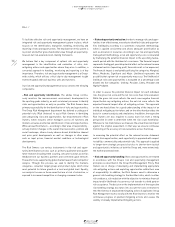
03 Wholesale net sales by region
2011
1 35% Western Europe
2 20% North America
3 15% Other Asian Markets
4 13% Latin America
5 12% Greater China
6 5% European Emerging Markets
6
5
1
2
3
4
most markets, in particular South Korea. In Latin America, currency-
neutral sales were up 8%, supported by double-digit sales growth in
Argentina and Chile. Currency translation effects had a mixed impact
on regional sales in euro terms
TABLE 02
.
Wholesale development by brand
In 2011, adidas Sport Performance wholesale revenues grew 10%
on a currency-neutral basis. Growth was mainly a result of double-
digit sales increases in the training, running, outdoor and basketball
categories. Currency translation effects had a negative impact on
revenues in euro terms. adidas Sport Performance sales grew 9% to
€ 5.578 billion from € 5.101 billion in the prior year.
Currency-neutral adidas Sport Style wholesale revenues grew 20%
in 2011. This increase was driven by strong momentum in most
categories, particularly adidas Originals and the adidas NEO label.
Currency translation effects negatively impacted revenues in euro
terms. adidas Sport Style sales grew 19% to € 1.861 billion (2010:
€ 1.559 billion).
In 2011, Reebok wholesale revenues increased 3% on a currency-
neutral basis. This was mainly the result of sales growth in the
training category due to the ZigTech and RealFlex platforms. Currency
translation effects negatively impacted revenues in euro terms.
Reebok sales remained virtually unchanged at € 1.499 billion (2010:
€ 1.505 billion).