Reebok 2011 Annual Report Download - page 122
Download and view the complete annual report
Please find page 122 of the 2011 Reebok annual report below. You can navigate through the pages in the report by either clicking on the pages listed below, or by using the keyword search tool below to find specific information within the annual report.-
 1
1 -
2
-
3
-
4
-
5
-
6
-
7
-
8
-
9
-
10
-
11
-
12
-
13
-
14
-
15
-
16
-
17
-
18
-
19
-
20
-
21
-
22
-
23
-
24
-
25
-
26
-
27
-
28
-
29
-
30
-
31
-
32
-
33
-
34
-
35
-
36
-
37
-
38
-
39
-
40
-
41
-
42
-
43
-
44
-
45
-
46
-
47
-
48
-
49
-
50
-
51
-
52
-
53
-
54
-
55
-
56
-
57
-
58
-
59
-
60
-
61
-
62
-
63
-
64
-
65
-
66
-
67
-
68
-
69
-
70
-
71
-
72
-
73
-
74
-
75
-
76
-
77
-
78
-
79
-
80
-
81
-
82
-
83
-
84
-
85
-
86
-
87
-
88
-
89
-
90
-
91
-
92
-
93
-
94
-
95
-
96
-
97
-
98
-
99
-
100
-
101
-
102
-
103
-
104
-
105
-
106
-
107
-
108
-
109
-
110
-
111
-
 112
112 -
 113
113 -
 114
114 -
 115
115 -
 116
116 -
 117
117 -
 118
118 -
 119
119 -
 120
120 -
 121
121 -
 122
122 -
 123
123 -
 124
124 -
 125
125 -
 126
126 -
 127
127 -
 128
128 -
 129
129 -
 130
130 -
 131
131 -
 132
132 -
133
-
134
-
135
-
136
-
137
-
138
-
139
-
140
-
141
-
142
-
143
-
144
-
145
-
146
-
147
-
148
-
149
-
150
-
151
-
152
-
153
-
154
-
155
-
156
-
157
-
158
-
159
-
160
-
161
-
162
-
163
-
164
-
165
-
166
-
167
-
168
-
169
-
170
-
171
-
172
-
173
-
174
-
175
-
176
-
177
-
178
-
179
-
180
-
181
-
182
-
183
-
184
-
185
-
186
-
187
-
188
-
189
-
190
-
191
-
192
-
193
-
194
-
195
-
196
-
197
-
198
-
199
-
200
-
201
-
202
-
203
-
204
-
205
-
206
-
207
-
208
-
209
-
210
-
211
-
212
-
213
-
214
-
215
-
216
-
217
-
218
-
219
-
220
-
221
-
222
-
223
-
224
-
225
-
226
-
227
-
228
-
229
-
230
-
231
-
232
-
233
-
234
-
235
-
236
-
237
-
238
-
239
-
240
-
241
-
242
 |
 |

adidas Group
2011 Annual Report
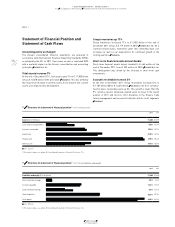
GROUP MANAGEMENT REPORT – FINANCIAL REVIEW
118
2011
In the USA, GDP increased 1.8% compared to 3.0% in the prior year.
High fuel prices and the uncertainties created by the deficit reduction
debate were both negatives on consumer confidence and business
sentiment in the first half of the year. However, consumer spending
and business hiring revived, albeit somewhat modestly, in the second
half of the year, driven by a decline in energy prices, pent-up demand
and further monetary easing. Despite evidence that the residential
real estate market had begun to stabilise, imbalances in the mortgage
market and relatively high unemployment levels continued to limit
spending in many households.
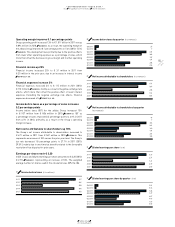
03.2 Group Business Performance Economic and Sector Development
Group Business Performance
In 2011, the adidas Group delivered a strong financial performance. Currency-neutral Group sales
increased 13% as a result of double-digit growth in the Wholesale and Retail segments as well as in Other
Businesses. In euro terms, adidas Group revenues grew 11% to € 13.344 billion from € 11.990 billion in
2010. The Group’s gross margin decreased 0.3 percentage points to 47.5% (2010: 47.8%), as the increase in
input costs more than offset the positive impact from a more favourable product and regional sales mix as
well as a larger share of higher-margin Retail sales. The Group’s gross profit rose 11% to € 6.344 billion
in 2011 versus € 5.730 billion in 2010. The Group’s operating margin was up 0.1 percentage points to 7.6%
from 7.5% in 2010. This was primarily due to the positive effects from lower other operating expenses as
a percentage of sales, which more than offset a decrease in gross margin and in other operating income.
The Group’s operating profit grew 13% to € 1.011 billion in 2011 versus € 894 million in 2010. The Group’s
net income attributable to shareholders increased 18% to € 671 million from € 567 million in 2010. Basic
and diluted earnings per share grew 18% to € 3.20 in 2011 versus € 2.71 in 2010.
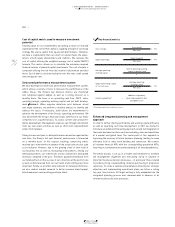
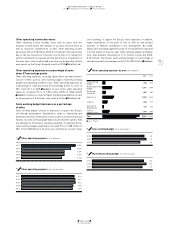
03.2
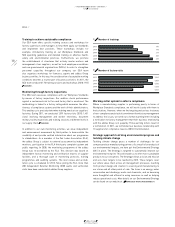
01 Regional GDP development 1) (in %)
Global Western
Europe
European
emerging
markets
USA Asia 2) Latin
America
9
6
3
0
(3)
■ 2009 ■ 2010 ■ 2011 Source: World Bank, HSBC.
1) Real, percentage change versus prior year;
2009 and 2010 figures restated compared to prior year.
2) Asia also includes Japan and Area Pacific.
Economic and Sector Development
Global economy expands 2.7% in 2011
In 2011, global GDP growth moderated to 2.7%, compared to 4.1% in
the prior year. The emerging markets grew significantly faster than
the developed economies, expanding 6.0% and 1.6% respectively.
Economic expansion was mainly driven by industrial activity and
domestic consumption in the emerging markets, particularly in China
and India. However, the European debt crisis, the downgrade of the
sovereign ratings of many major economies, the effect of the earth-
quake and tsunami in Japan, as well as political revolutions in many
Arab countries were all major challenges for and disruptions to global
economic activity during the year.
In Western Europe, GDP increased 1.5% (2010: 1.9%), driven in
particular by Germany’s domestic consumption and exports. The euro
debt crisis remained a key challenge for the region, as political uncer-
tainty on finding a resolution, acute austerity measures and fiscal
tightening inhibited confidence and economic activity.
European emerging markets’ GDP growth kept pace with the prior
year at around 4.5% (2010: 4.4%). Despite the negative effects from
the euro debt crisis and high unemployment levels in many markets,
strong domestic demand and exports positively impacted economic
growth. Russia in particular benefited from high oil prices and
increased output.