Reebok 2011 Annual Report Download - page 130
Download and view the complete annual report
Please find page 130 of the 2011 Reebok annual report below. You can navigate through the pages in the report by either clicking on the pages listed below, or by using the keyword search tool below to find specific information within the annual report.-
 1
1 -
2
-
3
-
4
-
5
-
6
-
7
-
8
-
9
-
10
-
11
-
12
-
13
-
14
-
15
-
16
-
17
-
18
-
19
-
20
-
21
-
22
-
23
-
24
-
25
-
26
-
27
-
28
-
29
-
30
-
31
-
32
-
33
-
34
-
35
-
36
-
37
-
38
-
39
-
40
-
41
-
42
-
43
-
44
-
45
-
46
-
47
-
48
-
49
-
50
-
51
-
52
-
53
-
54
-
55
-
56
-
57
-
58
-
59
-
60
-
61
-
62
-
63
-
64
-
65
-
66
-
67
-
68
-
69
-
70
-
71
-
72
-
73
-
74
-
75
-
76
-
77
-
78
-
79
-
80
-
81
-
82
-
83
-
84
-
85
-
86
-
87
-
88
-
89
-
90
-
91
-
92
-
93
-
94
-
95
-
96
-
97
-
98
-
99
-
100
-
101
-
102
-
103
-
104
-
105
-
106
-
107
-
108
-
109
-
110
-
111
-
112
-
113
-
114
-
115
-
116
-
117
-
118
-
119
-
 120
120 -
 121
121 -
 122
122 -
 123
123 -
 124
124 -
 125
125 -
 126
126 -
 127
127 -
 128
128 -
 129
129 -
 130
130 -
 131
131 -
 132
132 -
 133
133 -
 134
134 -
 135
135 -
 136
136 -
 137
137 -
 138
138 -
 139
139 -
 140
140 -
141
-
142
-
143
-
144
-
145
-
146
-
147
-
148
-
149
-
150
-
151
-
152
-
153
-
154
-
155
-
156
-
157
-
158
-
159
-
160
-
161
-
162
-
163
-
164
-
165
-
166
-
167
-
168
-
169
-
170
-
171
-
172
-
173
-
174
-
175
-
176
-
177
-
178
-
179
-
180
-
181
-
182
-
183
-
184
-
185
-
186
-
187
-
188
-
189
-
190
-
191
-
192
-
193
-
194
-
195
-
196
-
197
-
198
-
199
-
200
-
201
-
202
-
203
-
204
-
205
-
206
-
207
-
208
-
209
-
210
-
211
-
212
-
213
-
214
-
215
-
216
-
217
-
218
-
219
-
220
-
221
-
222
-
223
-
224
-
225
-
226
-
227
-
228
-
229
-
230
-
231
-
232
-
233
-
234
-
235
-
236
-
237
-
238
-
239
-
240
-
241
-
242
 |
 |

adidas Group
2011 Annual Report
GROUP MANAGEMENT REPORT – FINANCIAL REVIEW
126
2011
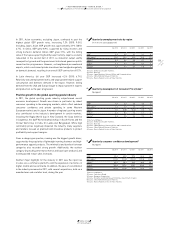
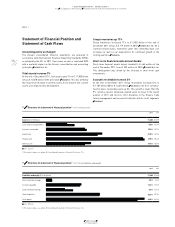
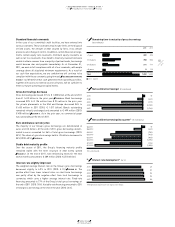
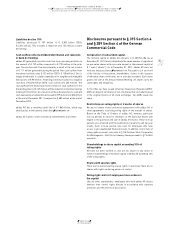
03.2 Group Business Performance Statement of Financial Position and Statement of Cash Flows
03.2
33 Structure of statement of financial position 1) (in % of total assets)
2011 2010
Assets (€ in millions) 11,380 10,618
Cash and cash equivalents 8.0% 10.9%
Accounts receivable 15.0% 15.7%
Inventories 21.8% 20.0%
Fixed assets 37.8% 38.4%
Other assets 17.4% 15.0%
■ 2011 ■ 2010
1) For absolute figures see adidas AG Consolidated Statement of Financial Position, p. 174.
34 Structure of statement of financial position 1) (in % of total liabilities and equity)
2011 2010
Liabilities and equity (€ in millions) 11,380 10,618
Short-term borrowings 2.5% 2.6%
Accounts payable 16.6% 16.0%
Long-term borrowings 8.7% 12.6%
Other liabilities 25.4% 25.3%
Total equity 46.8% 43.5%
■ 2011 ■ 2010
1) For absolute figures see adidas AG Consolidated Statement of Financial Position, p. 174.
Statement of Financial Position and
Statement of Cash Flows
Accounting policy unchanged
The Group’s consolidated financial statements are prepared in
accordance with International Financial Reporting Standards (IFRS),
as adopted by the EU. In 2011, there were no new or amended IFRS
with a material impact on the Group’s consolidation and accounting
principles
SEE NOTE 01, P. 181
.
Total assets increase 7%
At the end of December 2011, total assets grew 7% to € 11.380 billion
versus € 10.618 billion in the prior year
DIAGRAM 35
. This was primarily
the result of an increase in current assets. An increase in non-current
assets also impacted this development.
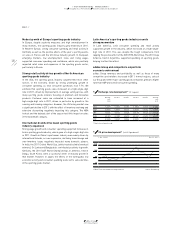
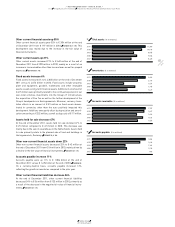
Group inventories up 17%
Group inventories increased 17% to € 2.482 billion at the end of
December 2011 versus € 2.119 billion in 2010
SEE NOTE 08, P. 190
. On a
currency-neutral basis, inventories grew 16%, reflecting input cost
increases as well as our expectations for continued growth in the
coming quarters
DIAGRAM 36
.
Short-term financial assets almost double
Short-term financial assets almost doubled to € 465 million at the
end of December 2011 from € 233 million in 2010
SEE NOTE 05, P. 189
.
This development was driven by the increase in short-term cash
investments.
Accounts receivable increase 2%
At the end of December 2011, Group receivables increased 2% to
€ 1.707 billion (2010: € 1.667 billion)
SEE NOTE 06, P. 189
. On a currency-
neutral basis, receivables were up 3%. This growth is lower than the
9% currency-neutral wholesale-related sales increase in the fourth
quarter of 2011 and mirrors strict discipline in the Group’s trade
terms management and concerted collection efforts in all segments
DIAGRAM 37
.