Reebok 2011 Annual Report Download - page 217
Download and view the complete annual report
Please find page 217 of the 2011 Reebok annual report below. You can navigate through the pages in the report by either clicking on the pages listed below, or by using the keyword search tool below to find specific information within the annual report.-
 1
1 -
2
-
3
-
4
-
5
-
6
-
7
-
8
-
9
-
10
-
11
-
12
-
13
-
14
-
15
-
16
-
17
-
18
-
19
-
20
-
21
-
22
-
23
-
24
-
25
-
26
-
27
-
28
-
29
-
30
-
31
-
32
-
33
-
34
-
35
-
36
-
37
-
38
-
39
-
40
-
41
-
42
-
43
-
44
-
45
-
46
-
47
-
48
-
49
-
50
-
51
-
52
-
53
-
54
-
55
-
56
-
57
-
58
-
59
-
60
-
61
-
62
-
63
-
64
-
65
-
66
-
67
-
68
-
69
-
70
-
71
-
72
-
73
-
74
-
75
-
76
-
77
-
78
-
79
-
80
-
81
-
82
-
83
-
84
-
85
-
86
-
87
-
88
-
89
-
90
-
91
-
92
-
93
-
94
-
95
-
96
-
97
-
98
-
99
-
100
-
101
-
102
-
103
-
104
-
105
-
106
-
107
-
108
-
109
-
110
-
111
-
112
-
113
-
114
-
115
-
116
-
117
-
118
-
119
-
120
-
121
-
122
-
123
-
124
-
125
-
126
-
127
-
128
-
129
-
130
-
131
-
132
-
133
-
134
-
135
-
136
-
137
-
138
-
139
-
140
-
141
-
142
-
143
-
144
-
145
-
146
-
147
-
148
-
149
-
150
-
151
-
152
-
153
-
154
-
155
-
156
-
157
-
158
-
159
-
160
-
161
-
162
-
163
-
164
-
165
-
166
-
167
-
168
-
169
-
170
-
171
-
172
-
173
-
174
-
175
-
176
-
177
-
178
-
179
-
180
-
181
-
182
-
183
-
184
-
185
-
186
-
187
-
188
-
189
-
190
-
191
-
192
-
193
-
194
-
195
-
196
-
197
-
198
-
199
-
200
-
201
-
202
-
203
-
204
-
205
-
206
-
 207
207 -
 208
208 -
 209
209 -
 210
210 -
 211
211 -
 212
212 -
 213
213 -
 214
214 -
 215
215 -
 216
216 -
 217
217 -
 218
218 -
 219
219 -
 220
220 -
 221
221 -
 222
222 -
 223
223 -
 224
224 -
 225
225 -
 226
226 -
 227
227 -
228
-
229
-
230
-
231
-
232
-
233
-
234
-
235
-
236
-
237
-
238
-
239
-
240
-
241
-
242
 |
 |

adidas Group
2011 Annual Report
CONSOLIDATED FINANCIAL STATEMENTS
213
2011
213
2011
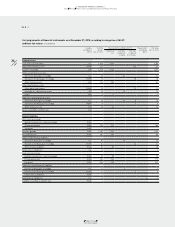
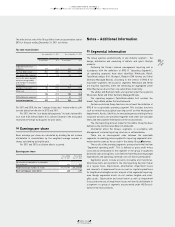
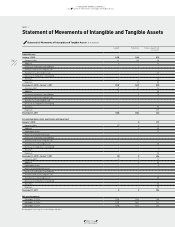
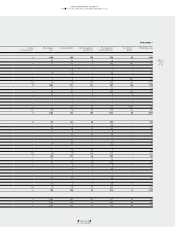
04.8 Notes Notes – Additional Information
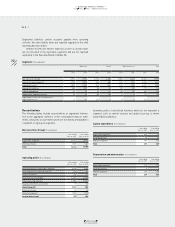
Impairment losses, net of reversals of impairment losses
(€ in millions)
Year ending
Dec. 31, 2011
Year ending
Dec. 31, 2010
Reportable segments (1) 3
Other businesses 0 0
HQ/Consolidation 0 11
Total (1) 14
Total assets (€ in millions)
Dec. 31, 2011 Dec. 31, 2010
Accounts receivable and inventories of reportable
segments 3,562 3,231
Accounts receivable and inventories of other
businesses 639 514
Segmental assets 4,201 3,745
Non-segmental accounts receivable and
inventories (12) 41
Current financial assets 1,674 1,586
Other current assets 572 508
Non-current assets 4,945 4,738
Total 11,380 10,618
Total liabilities (€ in millions)
Dec. 31, 2011 Dec. 31, 2010
Accounts payable of reportable segments 579 613
Accounts payable of other businesses 138 110
Segmental liabilities 717 723
Non-segmental accounts payable 1,169 971
Current financial liabilities 345 396
Other current liabilities 2,050 1,818
Non-current liabilities 1,768 2,087
Total 6,049 5,995
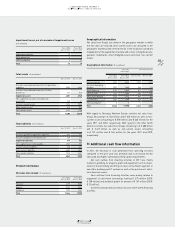
Product information
Net sales (non-Group) (€ in millions)
Year ending
Dec. 31, 2011
Year ending
Dec. 31, 2010
Footwear 6,275 5,389
Apparel 5,734 5,380
Hardware 1,335 1,221
Total 13,344 11,990
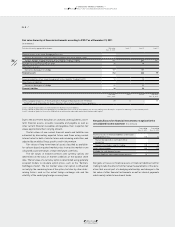
Geographical information
Net sales (non-Group) are shown in the geographic market in which
the net sales are realised. Non-current assets are allocated to the
geographic market based on the domicile of the respective subsidiary
independent of the segmental structure and consist of tangible assets,
goodwill, trademarks, other intangible assets and other non-current
assets.
Geographical information (€ in millions)
Net sales
(non-Group)
Non-current assets
Year ending
Dec. 31, 2011
Year ending
Dec. 31, 2010
Dec. 31, 2011 Dec. 31, 2010
Western Europe 3,922 3,543 1,511 1,515
European Emerging
Markets 1,597 1,385 653 592
North America 3,102 2,805 877 683
Greater China 1,229 1,000 482 520
Other Asian Markets 2,125 1,972 581 557
Latin America 1,369 1,285 209 216
HQ/Consolidation 0 0 0 0
Total 13,344 11,990 4,313 4,083
With regard to Germany, Western Europe contains net sales (non-
Group) amounting to € 722 million and € 655 million as well as non-
current assets amounting to € 393 million and € 363 million for the
years 2011 and 2010, respectively. With regard to the USA, North
America contains net sales (non-Group) amounting to € 2.688 billion
and € 2.427 billion as well as non-current assets amounting
to € 701 million and € 546 million for the years 2011 and 2010,
respectively.
36 Additional cash flow information
In 2011, the decrease in cash generated from operating activities
compared to the prior year was primarily due to increased income
taxes paid and higher operating working capital requirements.
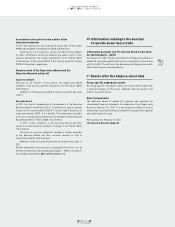
Net cash outflow from investing activities in 2011 was mainly
related to spending for property, plant and equipment such as invest-
ments in the furnishing and fitting of stores in the Retail segment, in
new office buildings and IT systems as well as the purchase of short-
term financial assets.
Cash outflows from financing activities were mainly related to
repayment of short-term borrowings totalling € 273 million (2010:
€ 198 million) and dividends paid in an amount of € 167 million (2010:
€ 73 million).
Current revolving financial transactions are offset within financing
activities.