Reebok 2011 Annual Report Download - page 144
Download and view the complete annual report
Please find page 144 of the 2011 Reebok annual report below. You can navigate through the pages in the report by either clicking on the pages listed below, or by using the keyword search tool below to find specific information within the annual report.-
 1
1 -
2
-
3
-
4
-
5
-
6
-
7
-
8
-
9
-
10
-
11
-
12
-
13
-
14
-
15
-
16
-
17
-
18
-
19
-
20
-
21
-
22
-
23
-
24
-
25
-
26
-
27
-
28
-
29
-
30
-
31
-
32
-
33
-
34
-
35
-
36
-
37
-
38
-
39
-
40
-
41
-
42
-
43
-
44
-
45
-
46
-
47
-
48
-
49
-
50
-
51
-
52
-
53
-
54
-
55
-
56
-
57
-
58
-
59
-
60
-
61
-
62
-
63
-
64
-
65
-
66
-
67
-
68
-
69
-
70
-
71
-
72
-
73
-
74
-
75
-
76
-
77
-
78
-
79
-
80
-
81
-
82
-
83
-
84
-
85
-
86
-
87
-
88
-
89
-
90
-
91
-
92
-
93
-
94
-
95
-
96
-
97
-
98
-
99
-
100
-
101
-
102
-
103
-
104
-
105
-
106
-
107
-
108
-
109
-
110
-
111
-
112
-
113
-
114
-
115
-
116
-
117
-
118
-
119
-
120
-
121
-
122
-
123
-
124
-
125
-
126
-
127
-
128
-
129
-
130
-
131
-
132
-
133
-
 134
134 -
 135
135 -
 136
136 -
 137
137 -
 138
138 -
 139
139 -
 140
140 -
 141
141 -
 142
142 -
 143
143 -
 144
144 -
 145
145 -
 146
146 -
 147
147 -
 148
148 -
 149
149 -
 150
150 -
 151
151 -
 152
152 -
 153
153 -
 154
154 -
155
-
156
-
157
-
158
-
159
-
160
-
161
-
162
-
163
-
164
-
165
-
166
-
167
-
168
-
169
-
170
-
171
-
172
-
173
-
174
-
175
-
176
-
177
-
178
-
179
-
180
-
181
-
182
-
183
-
184
-
185
-
186
-
187
-
188
-
189
-
190
-
191
-
192
-
193
-
194
-
195
-
196
-
197
-
198
-
199
-
200
-
201
-
202
-
203
-
204
-
205
-
206
-
207
-
208
-
209
-
210
-
211
-
212
-
213
-
214
-
215
-
216
-
217
-
218
-
219
-
220
-
221
-
222
-
223
-
224
-
225
-
226
-
227
-
228
-
229
-
230
-
231
-
232
-
233
-
234
-
235
-
236
-
237
-
238
-
239
-
240
-
241
-
242
 |
 |

adidas Group
2011 Annual Report
GROUP MANAGEMENT REPORT – FINANCIAL REVIEW
140
2011
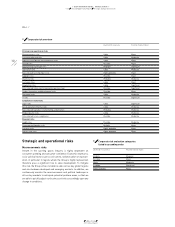
Segmental operating profit increased 31% to € 593 million versus
€ 452 million in the prior year. Segmental operating margin improved
2.3 percentage points to 21.2% (2010: 18.9%)
TABLE 08
. This was a
result of the gross margin increase and lower segmental operating
expenses as a percentage of sales.
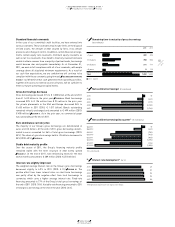
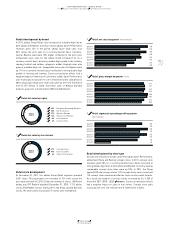
Retail development by region
Currency-neutral Retail sales increased in all regions. Retail revenues
in Western Europe grew 11% on a currency-neutral basis, mainly due
to increases in Germany, the UK, France, Italy and Spain. Sales in
European Emerging Markets rose 32% on a currency-neutral basis,
driven by growth in Russia where both the adidas and Reebok brands
had strong double-digit sales growth. Currency-neutral Retail sales
in North America grew 14% due to double-digit growth in the USA.
Retail revenues in Greater China increased 20% on a currency-neutral
basis. Sales in Other Asian Markets grew 9% on a currency-neutral
basis, mainly driven by double-digit increases in South Korea. In Latin
America, currency-neutral Retail sales grew 20%, with double-digit
sales increases in all markets except Mexico, where sales were up
at a high-single-digit rate. Currency translation effects had a mixed
impact on regional sales in euro terms
TABLE 09
.
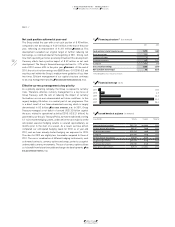
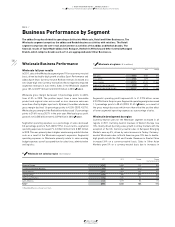
03.3 Business Performance by Segment Retail Business Performance
03.3
08 Retail at a glance (€ in millions)
2011 2010 Change
Net sales 2,793 2,389 17%
Gross profit 1,749 1,476 18%
Gross margin 62.6% 61.8% 0.8pp
Segmental operating profit 593 452 31%
Segmental operating margin 21.2% 18.9% 2.3pp
09 Retail net sales by region (€ in millions)
2011 2010 Change Change
(currency-neutral)
Western Europe 476 426 12% 11%
European Emerging Markets 1,055 846 25% 32%
North America 504 461 10% 14%
Greater China 157 131 19% 20%
Other Asian Markets 373 330 13% 9%
Latin America 228 195 17% 20%
Total 1) 2,793 2,389 17% 20%
1) Rounding differences may arise in totals.
Retail Business Performance
Retail full year results
In 2011, currency-neutral Retail sales increased 20%. Concept store,
factory outlet and other retail format currency-neutral sales were
all up at double-digit rates versus the prior year. Currency trans-
lation effects negatively impacted segmental revenues in euro terms.
Sales grew 17% to € 2.793 billion from € 2.389 billion in the prior year
TABLE 08
. Currency-neutral comparable store sales rose 14% versus
the prior year, with increases in all store formats.
Gross margin in the Retail segment increased 0.8 percentage points
to 62.6% from 61.8% in 2010. This was mainly a result of a higher
proportion of concept store sales which achieve higher margins
in comparison to factory outlets and other retail formats. Factory
outlet sales margins also grew year-over-year. By brand, the adidas
gross margin grew 0.3 percentage points to 63.6% (2010: 63.2%) and
Reebok’s gross margin improved 3.0 percentage points to 57.8%
(2010: 54.8%). Retail gross profit increased 18% to € 1.749 billion from
€ 1.476 billion in 2010
TABLE 08
.
Segmental operating expenses increased 13% to € 1.156 billion from
€ 1.024 billion in 2010. This was a result of higher sales working
budget expenses and higher expenses related to the expansion of
the Group’s store base, particularly in emerging markets. Segmental
operating expenses as a percentage of sales declined 1.5 percentage
points to 41.4% (2010: 42.9%), as a result of operating leverage in the
segment. Segmental operating expenses in Retail primarily relate to
personnel and rent expenses as well as the sales working budget.