Reebok 2011 Annual Report Download - page 145
Download and view the complete annual report
Please find page 145 of the 2011 Reebok annual report below. You can navigate through the pages in the report by either clicking on the pages listed below, or by using the keyword search tool below to find specific information within the annual report.-
 1
1 -
2
-
3
-
4
-
5
-
6
-
7
-
8
-
9
-
10
-
11
-
12
-
13
-
14
-
15
-
16
-
17
-
18
-
19
-
20
-
21
-
22
-
23
-
24
-
25
-
26
-
27
-
28
-
29
-
30
-
31
-
32
-
33
-
34
-
35
-
36
-
37
-
38
-
39
-
40
-
41
-
42
-
43
-
44
-
45
-
46
-
47
-
48
-
49
-
50
-
51
-
52
-
53
-
54
-
55
-
56
-
57
-
58
-
59
-
60
-
61
-
62
-
63
-
64
-
65
-
66
-
67
-
68
-
69
-
70
-
71
-
72
-
73
-
74
-
75
-
76
-
77
-
78
-
79
-
80
-
81
-
82
-
83
-
84
-
85
-
86
-
87
-
88
-
89
-
90
-
91
-
92
-
93
-
94
-
95
-
96
-
97
-
98
-
99
-
100
-
101
-
102
-
103
-
104
-
105
-
106
-
107
-
108
-
109
-
110
-
111
-
112
-
113
-
114
-
115
-
116
-
117
-
118
-
119
-
120
-
121
-
122
-
123
-
124
-
125
-
126
-
127
-
128
-
129
-
130
-
131
-
132
-
133
-
134
-
 135
135 -
 136
136 -
 137
137 -
 138
138 -
 139
139 -
 140
140 -
 141
141 -
 142
142 -
 143
143 -
 144
144 -
 145
145 -
 146
146 -
 147
147 -
 148
148 -
 149
149 -
 150
150 -
 151
151 -
 152
152 -
 153
153 -
 154
154 -
 155
155 -
156
-
157
-
158
-
159
-
160
-
161
-
162
-
163
-
164
-
165
-
166
-
167
-
168
-
169
-
170
-
171
-
172
-
173
-
174
-
175
-
176
-
177
-
178
-
179
-
180
-
181
-
182
-
183
-
184
-
185
-
186
-
187
-
188
-
189
-
190
-
191
-
192
-
193
-
194
-
195
-
196
-
197
-
198
-
199
-
200
-
201
-
202
-
203
-
204
-
205
-
206
-
207
-
208
-
209
-
210
-
211
-
212
-
213
-
214
-
215
-
216
-
217
-
218
-
219
-
220
-
221
-
222
-
223
-
224
-
225
-
226
-
227
-
228
-
229
-
230
-
231
-
232
-
233
-
234
-
235
-
236
-
237
-
238
-
239
-
240
-
241
-
242
 |
 |
adidas Group
2011 Annual Report
GROUP MANAGEMENT REPORT – FINANCIAL REVIEW
141
2011
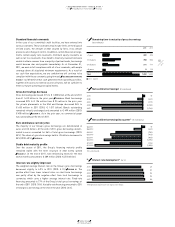
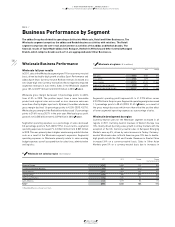
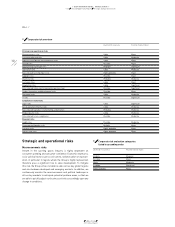
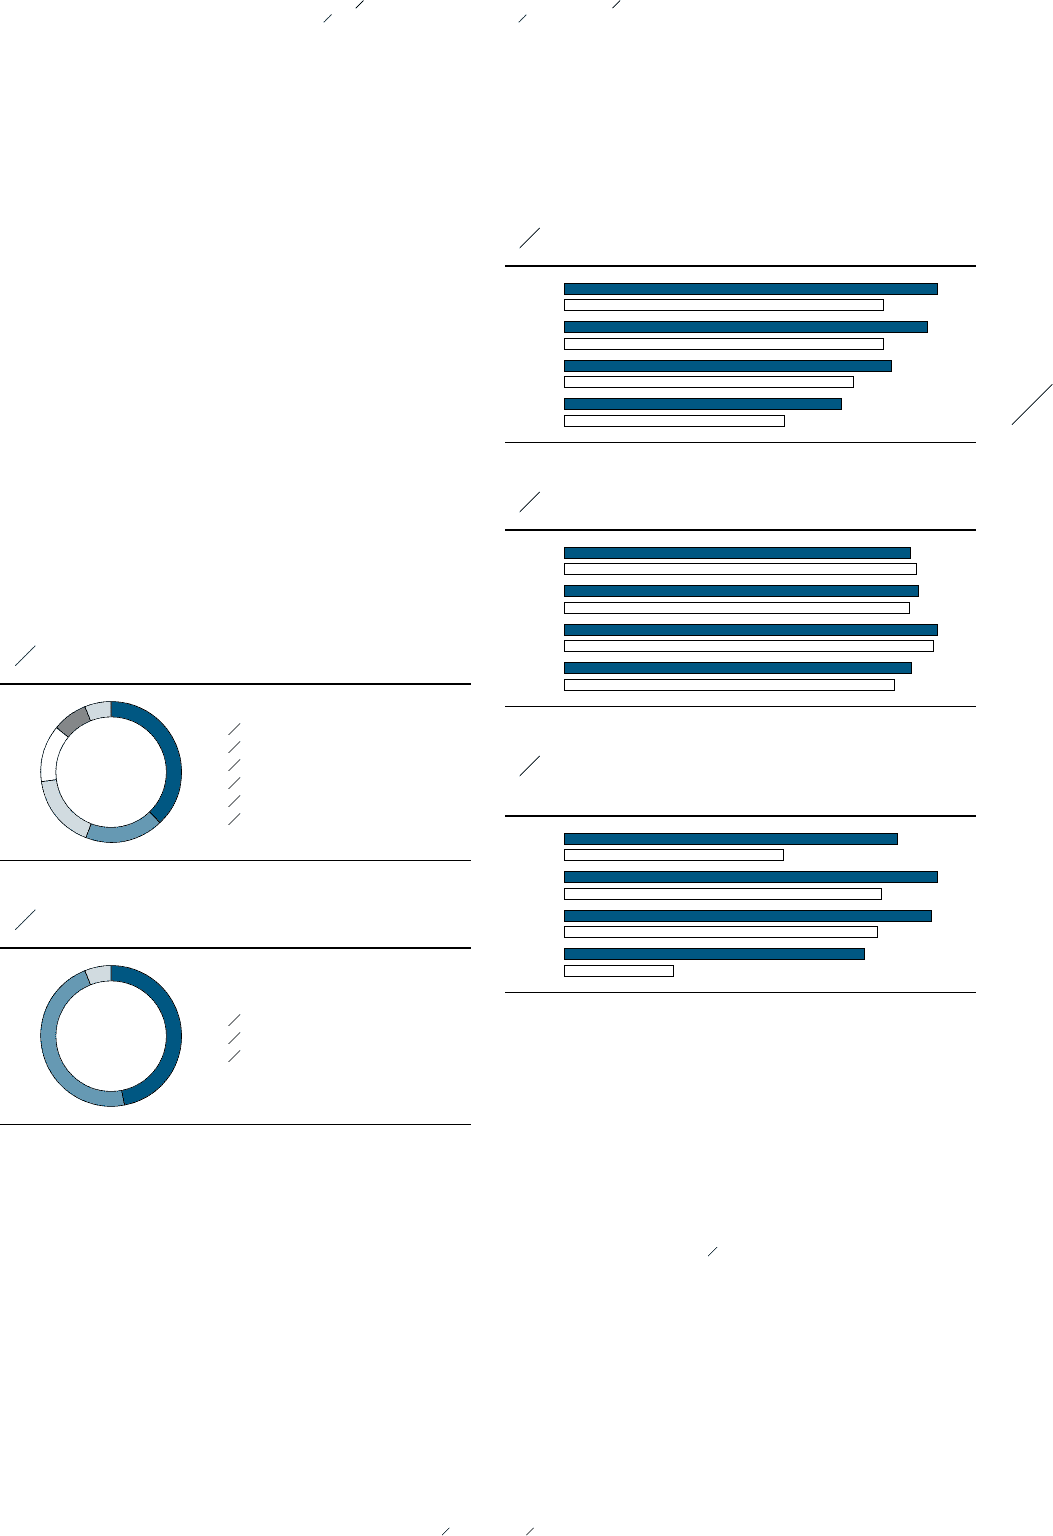
03.3 Business Performance by Segment Retail Business Performance
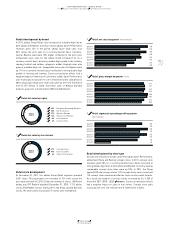
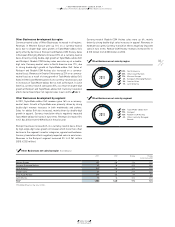
11 Retail net sales by store format
2011 1 47% Concept stores
2 47% Factory outlets
3 6% Other store formats
1
2
3
10 Retail net sales by region
2011
1 38% European Emerging Markets
2 18% North America
3 17% Western Europe
4 13% Other Asian Markets
5 8% Latin America
6 6% Greater China
6
5
1
2
3
4
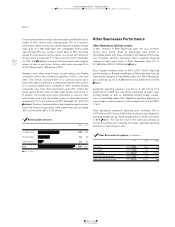
12 Retail net sales by quarter (€ in millions)
Q4 2011 778
Q4 2010 664
Q3 2011 757
Q3 2010 665
Q2 2011 681
Q2 2010 602
Q1 2011 577
Q1 2010 459
13 Retail gross margin by quarter (in %)
Q4 2011 61.1
Q4 2010 62.1
Q3 2011 62.3
Q3 2010 60.9
Q2 2011 65.8
Q2 2010 65.1
Q1 2011 61.2
Q1 2010 58.2
14 Retail segmental operating profit by quarter
(€ in millions)
Q4 2011 156
Q4 2010 103
Q3 2011 175
Q3 2010 149
Q2 2011 172
Q2 2010 147
Q1 2011 89
Q1 2010 52
Retail development by brand
In 2011, adidas Group Retail sales increased at a double-digit rate at
both adidas and Reebok. Currency-neutral adidas Sport Performance
revenues grew 15% in the period. adidas Sport Style sales rose
33% versus the prior year on a currency-neutral basis. Currency-
neutral Reebok sales were 18% higher compared to the prior year.
Comparable store sales for the adidas brand increased 14% on a
currency-neutral basis, driven by double-digit growth in the training,
running, football and outdoor categories. adidas Originals sales also
grew at a double-digit rate. Comparable store sales for Reebok were
up 11% on a currency-neutral basis, mainly due to strong double-digit
growth in running and training. Currency translation effects had a
negative impact on revenues in euro terms. adidas Sport Performance
own-retail sales increased 12% to € 1.576 billion from € 1.404 billion in
2010. adidas Sport Style own-retail sales were up 31% to € 752 million
from € 575 million in 2010. Own-retail sales of Reebok branded
products grew 14% to € 463 million (2010: € 408 million).
Retail development by store type
Concept store revenues include sales from adidas Sport Performance,
adidas Sport Style and Reebok concept stores. In 2011, concept store
revenues grew 28% on a currency-neutral basis. Sales increased at
strong double-digit rates at both adidas and Reebok. Currency-neutral
comparable concept store sales were up 18%. In 2011, the Group
opened 220 new concept stores, 107 concept stores were closed and
110 concept stores were reclassified as stores in other retail formats.
As a result, the number of concept stores increased by 3 to 1,355 at
the end of 2011 (2010: 1,352)
DIAGRAM 15
. Currency translation effects
had a negative impact on sales in euro terms. Concept store sales
increased 24% to € 1.311 billion from € 1.059 billion in 2010.
Retail store development
At December 31, 2011, the adidas Group Retail segment operated
2,401 stores. This represents a net increase of 131 or 6% versus the
prior year-end level of 2,270. Of the total number of stores, 1,804 were
adidas and 597 Reebok branded (December 31, 2010: 1,712 adidas
stores, 558 Reebok stores). During 2011, the Group opened 323 new
stores, 192 stores were closed and 151 stores were remodelled.