Reebok 2011 Annual Report Download - page 146
Download and view the complete annual report
Please find page 146 of the 2011 Reebok annual report below. You can navigate through the pages in the report by either clicking on the pages listed below, or by using the keyword search tool below to find specific information within the annual report.-
 1
1 -
2
-
3
-
4
-
5
-
6
-
7
-
8
-
9
-
10
-
11
-
12
-
13
-
14
-
15
-
16
-
17
-
18
-
19
-
20
-
21
-
22
-
23
-
24
-
25
-
26
-
27
-
28
-
29
-
30
-
31
-
32
-
33
-
34
-
35
-
36
-
37
-
38
-
39
-
40
-
41
-
42
-
43
-
44
-
45
-
46
-
47
-
48
-
49
-
50
-
51
-
52
-
53
-
54
-
55
-
56
-
57
-
58
-
59
-
60
-
61
-
62
-
63
-
64
-
65
-
66
-
67
-
68
-
69
-
70
-
71
-
72
-
73
-
74
-
75
-
76
-
77
-
78
-
79
-
80
-
81
-
82
-
83
-
84
-
85
-
86
-
87
-
88
-
89
-
90
-
91
-
92
-
93
-
94
-
95
-
96
-
97
-
98
-
99
-
100
-
101
-
102
-
103
-
104
-
105
-
106
-
107
-
108
-
109
-
110
-
111
-
112
-
113
-
114
-
115
-
116
-
117
-
118
-
119
-
120
-
121
-
122
-
123
-
124
-
125
-
126
-
127
-
128
-
129
-
130
-
131
-
132
-
133
-
134
-
135
-
 136
136 -
 137
137 -
 138
138 -
 139
139 -
 140
140 -
 141
141 -
 142
142 -
 143
143 -
 144
144 -
 145
145 -
 146
146 -
 147
147 -
 148
148 -
 149
149 -
 150
150 -
 151
151 -
 152
152 -
 153
153 -
 154
154 -
 155
155 -
 156
156 -
157
-
158
-
159
-
160
-
161
-
162
-
163
-
164
-
165
-
166
-
167
-
168
-
169
-
170
-
171
-
172
-
173
-
174
-
175
-
176
-
177
-
178
-
179
-
180
-
181
-
182
-
183
-
184
-
185
-
186
-
187
-
188
-
189
-
190
-
191
-
192
-
193
-
194
-
195
-
196
-
197
-
198
-
199
-
200
-
201
-
202
-
203
-
204
-
205
-
206
-
207
-
208
-
209
-
210
-
211
-
212
-
213
-
214
-
215
-
216
-
217
-
218
-
219
-
220
-
221
-
222
-
223
-
224
-
225
-
226
-
227
-
228
-
229
-
230
-
231
-
232
-
233
-
234
-
235
-
236
-
237
-
238
-
239
-
240
-
241
-
242
 |
 |

adidas Group
2011 Annual Report
GROUP MANAGEMENT REPORT – FINANCIAL REVIEW
142
2011
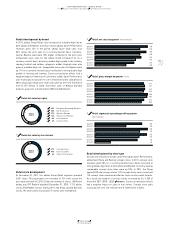
Factory outlet revenues include sales from adidas and Reebok factory
outlets. In 2011, factory outlet revenues grew 12% on a currency-
neutral basis. Sales increased at a double-digit rate at adidas. Reebok
sales grew at a high-single-digit rate. Comparable factory outlet
sales increased 9% on a currency-neutral basis. In 2011, the Group
opened 53 and closed 44 factory outlets. As a result, the number of
factory outlets increased by 9 to 734 at the end of 2011 (December
31, 2010: 725)
DIAGRAM 15
. Currency translation effects had a negative
impact on sales in euro terms. Factory outlet sales increased 9% to
€ 1.317 billion from € 1.203 billion in 2010.
Revenues from other retail formats include adidas and Reebok
concession corners and e-commerce operations. In 2011, sales from
other retail formats increased 35% on a currency-neutral basis.
Sales from adidas and Reebok e-commerce platforms were up 64%
on a currency-neutral basis compared to 2010. Currency-neutral
comparable sales from other retail formats grew 25%. In 2011, the
Group opened 50 new stores in other retail formats and closed 41.
In addition, 110 concept stores were reclassified as stores in other
retail formats. As a result, the number of stores in other retail formats
increased by 119 to 312 at the end of 2011 (December 31, 2010: 193)
DIAGRAM 15
. Currency translation effects had a negative impact on sales
from other formats in euro terms. Other retail format sales increased
30% to € 165 million (2010: € 127 million).
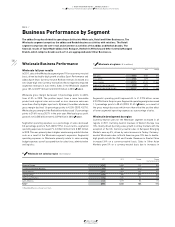
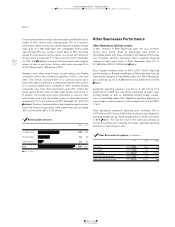
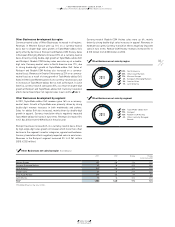
Other Businesses Performance
Other Businesses full year results
In 2011, revenues of Other Businesses grew 13% on a currency-
neutral basis, mainly driven by double-digit sales growth at
TaylorMade-adidas Golf. Sales at Rockport and Reebok-CCM Hockey
also increased. Currency translation effects negatively impacted
revenues in euro terms. Sales of Other Businesses grew 11% to
€ 1.580 billion (2010: € 1.420 billion)
TABLE 16
.
Gross margin remained stable at 43.5% (2010: 43.5%). Improving
product margins at Rockport and Reebok-CCM Hockey were offset by
lower product margins at TaylorMade-adidas Golf. Other Businesses
gross profit was up 11% to € 688 million versus € 618 million in 2010
TABLE 16
.
Segmental operating expenses rose 5% to € 261 million from
€ 249 million in 2010. This was driven in particular by higher sales
working budget as well as marketing working budget expend-
iture at TaylorMade-adidas Golf. Segmental operating expenses as
a percentage of sales decreased 1.1 percentage points to 16.5% (2010:
17.6%).
Other Businesses segmental operating profit increased 16% to
€ 427 million in 2011 versus € 369 million in the prior year. Segmental
operating margin was up 1.0 percentage points to 27.0% from 26.0%
in 2010
TABLE 16
. This was the result of the stable gross margin as
well as the positive effect resulting from lower segmental operating
expenses as a percentage of sales.
03.3 Business Performance by Segment Retail Business Performance Other Businesses Performance
03.3
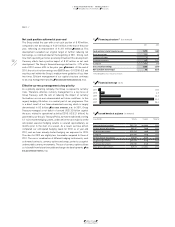
15 Retail number of stores
2011 2010
Concept stores 1,355 1,352
Factory outlets 734 725
Other formats 312 193
Total 2,401 2,270
■ 2011 ■ 2010
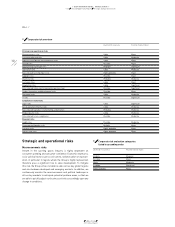
16 Other Businesses at a glance (€ in millions)
2011 2010 Change
Net sales 1,580 1,420 11%
Gross profit 688 618 11%
Gross margin 43.5% 43.5% (0.0pp)
Segmental operating profit 427 369 16%
Segmental operating margin 27.0% 26.0% 1.0pp