Reebok 2011 Annual Report Download - page 121
Download and view the complete annual report
Please find page 121 of the 2011 Reebok annual report below. You can navigate through the pages in the report by either clicking on the pages listed below, or by using the keyword search tool below to find specific information within the annual report.-
 1
1 -
2
-
3
-
4
-
5
-
6
-
7
-
8
-
9
-
10
-
11
-
12
-
13
-
14
-
15
-
16
-
17
-
18
-
19
-
20
-
21
-
22
-
23
-
24
-
25
-
26
-
27
-
28
-
29
-
30
-
31
-
32
-
33
-
34
-
35
-
36
-
37
-
38
-
39
-
40
-
41
-
42
-
43
-
44
-
45
-
46
-
47
-
48
-
49
-
50
-
51
-
52
-
53
-
54
-
55
-
56
-
57
-
58
-
59
-
60
-
61
-
62
-
63
-
64
-
65
-
66
-
67
-
68
-
69
-
70
-
71
-
72
-
73
-
74
-
75
-
76
-
77
-
78
-
79
-
80
-
81
-
82
-
83
-
84
-
85
-
86
-
87
-
88
-
89
-
90
-
91
-
92
-
93
-
94
-
95
-
96
-
97
-
98
-
99
-
100
-
101
-
102
-
103
-
104
-
105
-
106
-
107
-
108
-
109
-
110
-
 111
111 -
 112
112 -
 113
113 -
 114
114 -
 115
115 -
 116
116 -
 117
117 -
 118
118 -
 119
119 -
 120
120 -
 121
121 -
 122
122 -
 123
123 -
 124
124 -
 125
125 -
 126
126 -
 127
127 -
 128
128 -
 129
129 -
 130
130 -
 131
131 -
132
-
133
-
134
-
135
-
136
-
137
-
138
-
139
-
140
-
141
-
142
-
143
-
144
-
145
-
146
-
147
-
148
-
149
-
150
-
151
-
152
-
153
-
154
-
155
-
156
-
157
-
158
-
159
-
160
-
161
-
162
-
163
-
164
-
165
-
166
-
167
-
168
-
169
-
170
-
171
-
172
-
173
-
174
-
175
-
176
-
177
-
178
-
179
-
180
-
181
-
182
-
183
-
184
-
185
-
186
-
187
-
188
-
189
-
190
-
191
-
192
-
193
-
194
-
195
-
196
-
197
-
198
-
199
-
200
-
201
-
202
-
203
-
204
-
205
-
206
-
207
-
208
-
209
-
210
-
211
-
212
-
213
-
214
-
215
-
216
-
217
-
218
-
219
-
220
-
221
-
222
-
223
-
224
-
225
-
226
-
227
-
228
-
229
-
230
-
231
-
232
-
233
-
234
-
235
-
236
-
237
-
238
-
239
-
240
-
241
-
242
 |
 |

adidas Group
2011 Annual Report
GROUP MANAGEMENT REPORT – FINANCIAL REVIEW
117
2011
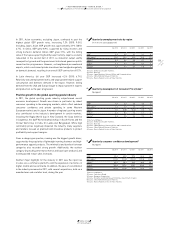
03.1 Internal Group Management System
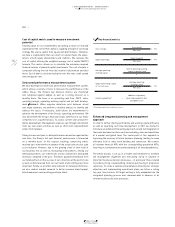
03 adidas Group targets versus actual key metrics
2010
Actual
2011
Initial outlook 1)
2011
Actual
2012
Targets
Sales
(year-over-year change, currency-neutral) 9%
mid- to high-single-digit
increase 13%
mid- to high-single-digit
increase
Gross margin 47.8% 47.5% to 48.0% 47.5% around 47.5%
Other operating expenses (in % of sales) 42.1% moderate decline 41.4% moderate decline
Operating margin 7.5% 7.5% to 8.0% 7.6% approaching 8.0%
(Diluted) earnings per share (in €) 2.71 2.98 to 3.12 3.20 3.52 to 3.68
Average operating working capital
(in % of net sales) 20.8% increase 20.8% moderate increase
Capital expenditure (€ in millions) 2) 269 350 to 400 376 400 to 450
Net cash/(net borrowings) (€ in millions) (221) further reduction 90
further reduction of gross
borrowings
1) As published on March 2, 2011. The outlook was updated over the course of the year.
2) Excluding acquisitions and finance leases.
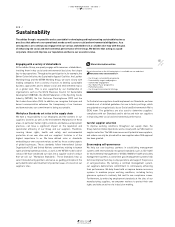
Management appraisal of performance and targets
We communicate our Group’s financial targets on an annual basis.
We also provide updates throughout the year as appropriate
TABLE 03
.
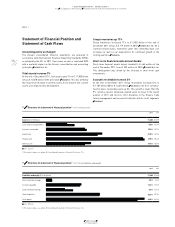
In 2011, Group sales and net income increased significantly. Group
sales development outperformed macroeconomic and global industry
growth
SEE ECONOMIC AND SECTOR DEVELOPMENT, P. 118
, due to sales increases
in all geographical areas. Stronger performances in North America
and the emerging markets as well as within our Retail segment
resulted in Group revenues exceeding our initial guidance of a mid- to
high-single-digit increase.
Profitability increased in line with our initial expectations, due to lower
other operating expenses as a percentage of sales
SEE INCOME STATEMENT,
P. 121
. As a result of our continued focus on operating working capital
and cash management, we exceeded our goals related to balance
sheet improvements in 2011 and ended the year with a net cash
position
SEE STATEMENT OF FINANCIAL POSITION AND STATEMENT OF CASH FLOWS, P. 126
.
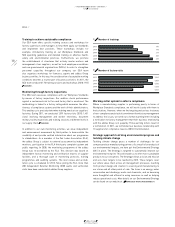
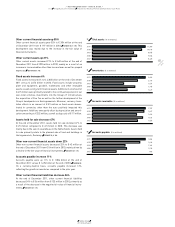
Our expectations for the Group’s business performance in 2012 are
based on continued global economic growth, albeit at a slightly lower
rate than in 2011, as well as a further strengthening of our business
in the emerging markets. Through our industry-leading innovation
strength, the extensive pipeline of new and fresh products, which
have received favourable reviews from retailers, as well as positive
effects from major sporting events, we project top- and bottom-line
improvements in our Group’s financial results in 2012. Profitability
improvements, however, will be dampened by continuing pressure on
raw material and labour costs which our industry is facing. In 2013
and beyond, assuming no deterioration in the global economy, we are
confident to further increase sales and earnings per share as outlined
under our Route 2015 strategic business plan. We believe that our
outlook is realistic within the scope of the current trading environment.
No material event between the end of 2011 and the publication of this
report has altered our view
SEE SUBSEQUENT EVENTS AND OUTLOOK, P. 163
.
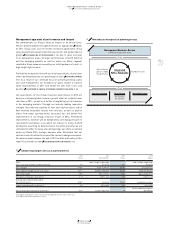
Management Business Review
Commercial Executive Team
Operations Review Sales Review
All channels
All markets
Marketing Review
Feedback results
Reconciliation
process led by
Group Finance
Integrated
KPIs + Financials
04 New industry best practice planning process