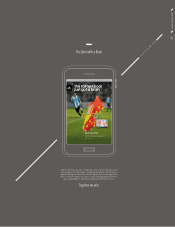
Reebok 2011 Annual Report Download - page 33
Download and view the complete annual report
Please find page 33 of the 2011 Reebok annual report below. You can navigate through the pages in the report by either clicking on the pages listed below, or by using the keyword search tool below to find specific information within the annual report.-
 1
1 -
2
-
3
-
4
-
5
-
6
-
7
-
8
-
9
-
10
-
11
-
12
-
13
-
14
-
15
-
16
-
17
-
18
-
19
-
20
-
21
-
22
-
 23
23 -
 24
24 -
 25
25 -
 26
26 -
 27
27 -
 28
28 -
 29
29 -
 30
30 -
 31
31 -
 32
32 -
 33
33 -
 34
34 -
 35
35 -
 36
36 -
 37
37 -
 38
38 -
 39
39 -
 40
40 -
 41
41 -
 42
42 -
 43
43 -
44
-
45
-
46
-
47
-
48
-
49
-
50
-
51
-
52
-
53
-
54
-
55
-
56
-
57
-
58
-
59
-
60
-
61
-
62
-
63
-
64
-
65
-
66
-
67
-
68
-
69
-
70
-
71
-
72
-
73
-
74
-
75
-
76
-
77
-
78
-
79
-
80
-
81
-
82
-
83
-
84
-
85
-
86
-
87
-
88
-
89
-
90
-
91
-
92
-
93
-
94
-
95
-
96
-
97
-
98
-
99
-
100
-
101
-
102
-
103
-
104
-
105
-
106
-
107
-
108
-
109
-
110
-
111
-
112
-
113
-
114
-
115
-
116
-
117
-
118
-
119
-
120
-
121
-
122
-
123
-
124
-
125
-
126
-
127
-
128
-
129
-
130
-
131
-
132
-
133
-
134
-
135
-
136
-
137
-
138
-
139
-
140
-
141
-
142
-
143
-
144
-
145
-
146
-
147
-
148
-
149
-
150
-
151
-
152
-
153
-
154
-
155
-
156
-
157
-
158
-
159
-
160
-
161
-
162
-
163
-
164
-
165
-
166
-
167
-
168
-
169
-
170
-
171
-
172
-
173
-
174
-
175
-
176
-
177
-
178
-
179
-
180
-
181
-
182
-
183
-
184
-
185
-
186
-
187
-
188
-
189
-
190
-
191
-
192
-
193
-
194
-
195
-
196
-
197
-
198
-
199
-
200
-
201
-
202
-
203
-
204
-
205
-
206
-
207
-
208
-
209
-
210
-
211
-
212
-
213
-
214
-
215
-
216
-
217
-
218
-
219
-
220
-
221
-
222
-
223
-
224
-
225
-
226
-
227
-
228
-
229
-
230
-
231
-
232
-
233
-
234
-
235
-
236
-
237
-
238
-
239
-
240
-
241
-
242
 |
 |

adidas Group
2011 Annual Report
TO OUR SHAREHOLDERS
29
2011
01.2 Interview with the CEO
? Herbert, 2011 was the first year of the Group’s strategic
business plan Route 2015. Have the financials lived up to
your expectations?
!
At the start of any strategic plan, it is important to gain
momentum quickly and set a precedent by hitting targets. In this
respect, 2011 certainly met my expectations, and in most cases
exceeded them. We enjoyed the Group’s highest organic growth rate
since 2006, as sales increased 13% currency-neutral. This means
we added € 1.4 billion in revenues, achieving over € 13.3 billion for
the year. We also made strong bottom-line progress, with earnings
per share growing 18% to a new record level of € 3.20. And we ended
the year with our balance sheet in top shape, with operating working
capital as a percentage of sales remaining at all-time lows of 20.8%,
and a net cash position of € 90 million. All in all, we have come out
of the blocks fast and are well on our way towards our 2015 strategic
goals.
? Looking at the business, which parts really stand out for you
in delivering this impressive growth?
!
What is most striking in our top-line development is the
broad-based growth we generated across all of our markets, brands
and channels. Clearly, we were big winners in our three key attack
markets, which accounted for more than 50% of the growth. Currency-
neutral sales in North America grew 15%, Russia/CIS was up 26% and
Greater China increased 23%. But an even greater achievement in my
opinion was our strong growth in Western Europe. Revenues were up
10% in a region facing significant economic pressure. This highlights
that, in tough times, the consumer and the customer gravitate towards
those brands that bring real and tangible value through innovation
and cutting-edge design. On a segmental basis, all of our segments
grew at a double-digit rate for the year. A key highlight was Retail,
which generated comparable store sales growth of 14%, a major
achievement following 11% comparable growth in the prior year. That
says a lot about the great progress we are making on improving our
Retail operations.
Looking at product categories, we resonated with consumers
around the world in all categories. Footwear sales were up 18%
currency-neutral, with football and running each growing over 20%,
and outdoor growing almost 50%. In apparel, sales were up a solid
8% currency-neutral, with growth in training and running more than
compensating for declines in football apparel due to high volumes
related to the FIFA World Cup in the prior year. In hardware, sales
were also exceptional for the year, as TaylorMade-adidas Golf drove
the category up 10%. Finally, it goes without saying that, once again,
adidas Sport Style was a major highlight, adding almost half a billion
in sales as it grew 24% to over € 2.6 billion. The global popularity of
adidas Originals as well as the expansion of the adidas NEO label in
the emerging markets drove this development.
? One of your key Route 2015 goals is to achieve an operating
margin of 11%. In 2011, your margins only modestly
increased. Are you disappointed with that?
!
No, quite the contrary, when I look back at the year, even
considering all the great top-line achievements, our operating margin
development is one of the key financial highlights we are most proud of
for 2011. As flagged several times over the past 18 months, the severe
pricing pressure we faced in procuring our products due to record-high
raw material costs and wage inflation in our Asian sourcing markets
restricted our progress. This eroded 2.3 percentage points of gross
margin in 2011, and being able to limit the negative effect to a mere
30 basis points is no small feat. And, in some areas, we were even
able to increase gross margins, such as in Retail by 80 basis points,
and at Reebok by 40 basis points. In terms of operating leverage, we
delivered as we promised, achieving a reduction in other operating
expenses as a percentage of sales of 70 basis points. Therefore, you
can take confidence from these results. They show our ability to tackle
major challenges and they highlight the discipline we are instilling in
the organisation to leverage our cost base as we grow.
? North America has been a major turnaround story for the
adidas brand. But the jury is still out on whether you can
make this a long-term success. What is your recipe to
succeed in the world’s largest sporting goods market?
!
At the end of the day, it’s all about track record. And this is what
we are creating. With our Route 2015 plan for the US, we are setting
up the right conditions for adidas to be successful in North America
long-term. This includes being more focused in our choices, consistent
in our execution, and consequent with our follow-through once we
start an initiative. Over the past two years, we have concentrated our
efforts on a smaller number of key initiatives, supporting them in the
right distribution channels and targeting our communication to attract
the next-generation consumer. And the numbers are coming through
powerfully. adidas brand sales in North America have increased
41% over the past two years, the biggest jump we have achieved
as a management team, with the 21% currency-neutral growth in
2011 being our best ever. All of our key categories – be it Originals,
running, basketball or training – posted solid growth. The shape of our
distribution mix is also evolving nicely, with strong market share gains
in the high-quality mall and sporting goods channels as well as further
diversification with important directional accounts regionally. When I
look at this, our outstanding product pipeline and how the brand is
resonating with the consumer and our customers, the consistency is
now where it needs to be. You will see this again in 2012 as we push to
achieve a hat-trick of years of double-digit growth for adidas in North
America.