Reebok 2011 Annual Report Download - page 171
Download and view the complete annual report
Please find page 171 of the 2011 Reebok annual report below. You can navigate through the pages in the report by either clicking on the pages listed below, or by using the keyword search tool below to find specific information within the annual report.-
 1
1 -
2
-
3
-
4
-
5
-
6
-
7
-
8
-
9
-
10
-
11
-
12
-
13
-
14
-
15
-
16
-
17
-
18
-
19
-
20
-
21
-
22
-
23
-
24
-
25
-
26
-
27
-
28
-
29
-
30
-
31
-
32
-
33
-
34
-
35
-
36
-
37
-
38
-
39
-
40
-
41
-
42
-
43
-
44
-
45
-
46
-
47
-
48
-
49
-
50
-
51
-
52
-
53
-
54
-
55
-
56
-
57
-
58
-
59
-
60
-
61
-
62
-
63
-
64
-
65
-
66
-
67
-
68
-
69
-
70
-
71
-
72
-
73
-
74
-
75
-
76
-
77
-
78
-
79
-
80
-
81
-
82
-
83
-
84
-
85
-
86
-
87
-
88
-
89
-
90
-
91
-
92
-
93
-
94
-
95
-
96
-
97
-
98
-
99
-
100
-
101
-
102
-
103
-
104
-
105
-
106
-
107
-
108
-
109
-
110
-
111
-
112
-
113
-
114
-
115
-
116
-
117
-
118
-
119
-
120
-
121
-
122
-
123
-
124
-
125
-
126
-
127
-
128
-
129
-
130
-
131
-
132
-
133
-
134
-
135
-
136
-
137
-
138
-
139
-
140
-
141
-
142
-
143
-
144
-
145
-
146
-
147
-
148
-
149
-
150
-
151
-
152
-
153
-
154
-
155
-
156
-
157
-
158
-
159
-
160
-
 161
161 -
 162
162 -
 163
163 -
 164
164 -
 165
165 -
 166
166 -
 167
167 -
 168
168 -
 169
169 -
 170
170 -
 171
171 -
 172
172 -
 173
173 -
 174
174 -
 175
175 -
 176
176 -
 177
177 -
 178
178 -
 179
179 -
 180
180 -
 181
181 -
182
-
183
-
184
-
185
-
186
-
187
-
188
-
189
-
190
-
191
-
192
-
193
-
194
-
195
-
196
-
197
-
198
-
199
-
200
-
201
-
202
-
203
-
204
-
205
-
206
-
207
-
208
-
209
-
210
-
211
-
212
-
213
-
214
-
215
-
216
-
217
-
218
-
219
-
220
-
221
-
222
-
223
-
224
-
225
-
226
-
227
-
228
-
229
-
230
-
231
-
232
-
233
-
234
-
235
-
236
-
237
-
238
-
239
-
240
-
241
-
242
 |
 |

adidas Group
2011 Annual Report
GROUP MANAGEMENT REPORT – FINANCIAL REVIEW
167
2011
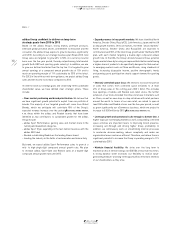
03.5 Subsequent Events and Outlook
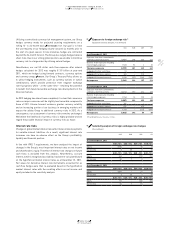
Earnings per share to increase to a level
between € 3.52 and € 3.68
Basic and diluted earnings per share are expected to increase at a
rate of 10% to 15% to a level between € 3.52 and € 3.68 (2011: € 3.20).
Top-line improvement and an increased operating margin will be the
primary drivers of this positive development. In addition, we expect
lower interest rate expenses in 2012 as a result of a lower average
level of gross borrowings. The Group tax rate is expected to be slightly
less favourable compared to the prior year, at a level around 28.5%
(2011: 27.7%).
Average operating working capital as a percentage
of sales to increase
In 2012, average operating working capital as a percentage of sales is
expected to increase slightly compared to the prior year level (2011:
20.8%). This is mainly due to working capital increases to support the
growth of our business.
Investment level to be between € 400 million
and € 450 million
In 2012, investments in tangible and intangible assets are expected to
amount to € 400 million to € 450 million (2011: € 376 million). Invest-
ments will focus on adidas and Reebok controlled space initiatives, in
particular in emerging markets. These investments will account for
around 40% of total investments in 2012. Other areas of investment
include the Group’s logistics infrastructure such as the construction of
our biggest distribution centre worldwide near Osnabrueck, Germany,
and the increased deployment of SAP and other IT systems in major
subsidiaries within the Group. All investments within the adidas Group
in 2012 are expected to be fully financed through cash generated from
operating activities.
Excess cash to be used to support growth initiatives
In 2012, we expect continued positive cash flow from operating
activities. Cash will be used to finance working capital needs,
investment activities, as well as dividend payments. We intend to
largely use excess cash to invest in our Route 2015 growth initiatives
and to further reduce gross borrowings. In order to ensure long-term
flexibility, we aim to maintain a ratio of net borrowings over EBITDA of
less than two times as measured at year-end (2011 ratio: –0.1).
Efficient liquidity management in place for 2012
and beyond
Efficient liquidity management continues to be a priority for the adidas
Group in 2012. We focus on continuously anticipating the operating
cash flows of our Group segments, as this represents the main
source of liquidity within the Group. On a quarterly basis, liquidity is
forecasted on a multi-year financial and liquidity plan. Long-term
liquidity is ensured by continued positive operating cash flows and
sufficient unused committed and uncommitted credit facilities. In
2012, we plan to replace our syndicated loan facility, which matures
during the course of the year
SEE TREASURY, P. 129
.
Management to propose dividend of € 1.00
In light of the strong cash flow generation in 2011 and resulting net
cash position at year-end, Management will recommend paying a
dividend of € 1.00 to shareholders at the Annual General Meeting
(AGM) on May 10, 2012, representing an increase of 25% compared
to the prior year (2010: € 0.80). Subject to shareholder approval, the
dividend will be paid on May 11, 2012. The proposal represents a payout
ratio of 31% of net income attributable to shareholders, compared to
30% in the prior year. This complies with our dividend policy, according
to which we intend to pay out between 20% and 40% of net income
attributable to shareholders annually. Based on the number of shares
outstanding at the end of 2011, the dividend payout will thus increase
to € 209 million compared to € 167 million in the prior year.