Reebok 2011 Annual Report Download - page 196
Download and view the complete annual report
Please find page 196 of the 2011 Reebok annual report below. You can navigate through the pages in the report by either clicking on the pages listed below, or by using the keyword search tool below to find specific information within the annual report.-
 1
1 -
2
-
3
-
4
-
5
-
6
-
7
-
8
-
9
-
10
-
11
-
12
-
13
-
14
-
15
-
16
-
17
-
18
-
19
-
20
-
21
-
22
-
23
-
24
-
25
-
26
-
27
-
28
-
29
-
30
-
31
-
32
-
33
-
34
-
35
-
36
-
37
-
38
-
39
-
40
-
41
-
42
-
43
-
44
-
45
-
46
-
47
-
48
-
49
-
50
-
51
-
52
-
53
-
54
-
55
-
56
-
57
-
58
-
59
-
60
-
61
-
62
-
63
-
64
-
65
-
66
-
67
-
68
-
69
-
70
-
71
-
72
-
73
-
74
-
75
-
76
-
77
-
78
-
79
-
80
-
81
-
82
-
83
-
84
-
85
-
86
-
87
-
88
-
89
-
90
-
91
-
92
-
93
-
94
-
95
-
96
-
97
-
98
-
99
-
100
-
101
-
102
-
103
-
104
-
105
-
106
-
107
-
108
-
109
-
110
-
111
-
112
-
113
-
114
-
115
-
116
-
117
-
118
-
119
-
120
-
121
-
122
-
123
-
124
-
125
-
126
-
127
-
128
-
129
-
130
-
131
-
132
-
133
-
134
-
135
-
136
-
137
-
138
-
139
-
140
-
141
-
142
-
143
-
144
-
145
-
146
-
147
-
148
-
149
-
150
-
151
-
152
-
153
-
154
-
155
-
156
-
157
-
158
-
159
-
160
-
161
-
162
-
163
-
164
-
165
-
166
-
167
-
168
-
169
-
170
-
171
-
172
-
173
-
174
-
175
-
176
-
177
-
178
-
179
-
180
-
181
-
182
-
183
-
184
-
185
-
 186
186 -
 187
187 -
 188
188 -
 189
189 -
 190
190 -
 191
191 -
 192
192 -
 193
193 -
 194
194 -
 195
195 -
 196
196 -
 197
197 -
 198
198 -
 199
199 -
 200
200 -
 201
201 -
 202
202 -
 203
203 -
 204
204 -
 205
205 -
 206
206 -
207
-
208
-
209
-
210
-
211
-
212
-
213
-
214
-
215
-
216
-
217
-
218
-
219
-
220
-
221
-
222
-
223
-
224
-
225
-
226
-
227
-
228
-
229
-
230
-
231
-
232
-
233
-
234
-
235
-
236
-
237
-
238
-
239
-
240
-
241
-
242
 |
 |

adidas Group
2011 Annual Report
CONSOLIDATED FINANCIAL STATEMENTS
192
2011
192
2011
04.8
04.8 Notes Notes to the Consolidated Statement of Financial Position
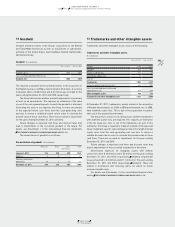
14 Long-term financial assets
Long-term financial assets include a 9.1% investment in FC Bayern
München AG (2010: 9.7%) of € 79 million (2010: € 79 million). The
percentage share held in the investment has decreased due to the
issuance of new shares which have been bought by another share-
holder. This investment is classified as “fair value through profit or
loss” and recorded at fair value. This equity security does not have a
quoted market price in an active market. Therefore, existing contrac-
tual settlements were used in order to calculate the fair value as
at December 31, 2011. Dividends are distributed by FC Bayern
München AG instead of regular interest payments.
Additionally, long-term financial assets include investments
which are mainly invested in insurance products and are measured at
fair value, as well as other financial assets.
Long-term financial assets (€ in millions)
Dec. 31, 2011 Dec. 31, 2010
Investment in FC Bayern München AG 79 79
Investments and other financial assets 18 14
Long-term financial assets 97 93
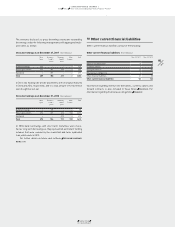
15 Other non-current financial assets
Other non-current financial assets consist of the following:
Other non-current financial assets (€ in millions)
Dec. 31, 2011 Dec. 31, 2010
Interest rate derivatives – 8
Currency options 8 12
Forward contracts 10 10
Security deposits 22 24
Other financial assets 2 –
Other non-current financial assets 42 54
Information regarding interest rate derivatives, currency options and
forward contracts is also included in these Notes
SEE ALSO NOTE 28
.
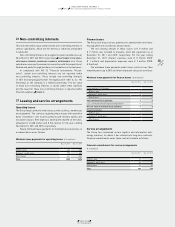
16 Other non-current assets
Other non-current assets consist of the following:
Other non-current assets (€ in millions)
Dec. 31, 2011 Dec. 31, 2010
Prepaid expenses 105 98
Sundry 2 2
Other non-current assets 107 100
Prepaid expenses mainly include prepayments for long-term promo-
tional contracts and service contracts
SEE NOTES 37 AND 27
.
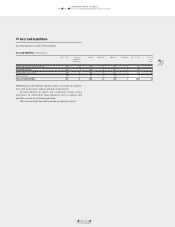
17 Borrowings and credit lines
Borrowings are denominated in a variety of currencies in which the
Group conducts its business. The largest portions of effective gross
borrowings (before liquidity swaps for cash management purposes)
as at December 31, 2011 are denominated in euros (2011: 56%; 2010:
55%) and US dollars (2011: 35%; 2010: 40%).
The weighted average interest rate on the Group’s gross
borrowings decreased to 4.9% in 2011 (2010: 5.1%).
As at December 31, 2011, the Group had cash credit lines and
other long-term financing arrangements totalling € 5.2 billion (2010:
€ 5.5 billion); thereof unused credit lines accounted for € 3.9 billion
(2010: € 3.9 billion). In addition, the Group had separate lines for the
issuance of letters of credit and guarantees in an amount of approxi-
mately € 0.2 billion (2010: € 0.3 billion).
The Group’s outstanding financings are unsecured and may include
standard financial covenants, which are reviewed on a quarterly basis.
These covenants may include limits on the disposal of fixed assets, the
maximum amount of debt secured by liens, cross default provisions
and change of control. In addition, certain financial arrangements
contain equity ratio covenants, minimum equity covenants as well as
net loss covenants.
As at December 31, 2011, and December 31, 2010, actual share-
holders’ equity was well above the amount of the minimum equity
covenant. Likewise, the relevant amount of net income clearly
exceeded net loss covenants.