Reebok 2011 Annual Report Download - page 109
Download and view the complete annual report
Please find page 109 of the 2011 Reebok annual report below. You can navigate through the pages in the report by either clicking on the pages listed below, or by using the keyword search tool below to find specific information within the annual report.-
 1
1 -
2
-
3
-
4
-
5
-
6
-
7
-
8
-
9
-
10
-
11
-
12
-
13
-
14
-
15
-
16
-
17
-
18
-
19
-
20
-
21
-
22
-
23
-
24
-
25
-
26
-
27
-
28
-
29
-
30
-
31
-
32
-
33
-
34
-
35
-
36
-
37
-
38
-
39
-
40
-
41
-
42
-
43
-
44
-
45
-
46
-
47
-
48
-
49
-
50
-
51
-
52
-
53
-
54
-
55
-
56
-
57
-
58
-
59
-
60
-
61
-
62
-
63
-
64
-
65
-
66
-
67
-
68
-
69
-
70
-
71
-
72
-
73
-
74
-
75
-
76
-
77
-
78
-
79
-
80
-
81
-
82
-
83
-
84
-
85
-
86
-
87
-
88
-
89
-
90
-
91
-
92
-
93
-
94
-
95
-
96
-
97
-
98
-
 99
99 -
 100
100 -
 101
101 -
 102
102 -
 103
103 -
 104
104 -
 105
105 -
 106
106 -
 107
107 -
 108
108 -
 109
109 -
 110
110 -
 111
111 -
 112
112 -
 113
113 -
 114
114 -
 115
115 -
 116
116 -
 117
117 -
 118
118 -
 119
119 -
120
-
121
-
122
-
123
-
124
-
125
-
126
-
127
-
128
-
129
-
130
-
131
-
132
-
133
-
134
-
135
-
136
-
137
-
138
-
139
-
140
-
141
-
142
-
143
-
144
-
145
-
146
-
147
-
148
-
149
-
150
-
151
-
152
-
153
-
154
-
155
-
156
-
157
-
158
-
159
-
160
-
161
-
162
-
163
-
164
-
165
-
166
-
167
-
168
-
169
-
170
-
171
-
172
-
173
-
174
-
175
-
176
-
177
-
178
-
179
-
180
-
181
-
182
-
183
-
184
-
185
-
186
-
187
-
188
-
189
-
190
-
191
-
192
-
193
-
194
-
195
-
196
-
197
-
198
-
199
-
200
-
201
-
202
-
203
-
204
-
205
-
206
-
207
-
208
-
209
-
210
-
211
-
212
-
213
-
214
-
215
-
216
-
217
-
218
-
219
-
220
-
221
-
222
-
223
-
224
-
225
-
226
-
227
-
228
-
229
-
230
-
231
-
232
-
233
-
234
-
235
-
236
-
237
-
238
-
239
-
240
-
241
-
242
 |
 |

adidas Group
2011 Annual Report
GROUP MANAGEMENT REPORT – OUR GROUP
105
2011
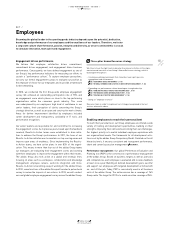
02.7 Employees
Global employee base continues to grow
On December 31, 2011, the Group had 46,824 employees, which
represents an increase of 10% versus 42,541 in the previous year
DIAGRAM 04
. This development is primarily related to the expansion of the
Group’s own-retail activities in emerging markets. An increase in the
sales force as well as additional hirings within our Global Operations
function, in order to support the Group’s sales growth, also contributed
to the overall increase in the number of employees. Furthermore, a
change in the internal definition of full-time equivalents also impacted
this development.
On a full-time equivalent basis, our Group had 40,637 employees on
December 31, 2011 (2010: 36,444). Due to the high share of employees
working on a part-time basis in the Retail segment, this figure is lower
than the figure reported on a headcount basis
TABLE 07
. Personnel
expenses increased 8% to € 1.646 billion in 2011 from € 1.521 billion
in 2010, representing 12% of Group sales (2010: 13%)
SEE NOTE 31, P. 209
.
At the end of 2011, 23% of our Group’s staff were employed in Western
Europe (2010: 23%), 33% in European Emerging Markets (2010: 34%),
25% in North America (2010: 24%), 4% in Greater China (2010: 4%), 9%
in Other Asian Markets (2010: 9%) and 6% in Latin America (2010: 6%)
DIAGRAM 06
. As a global company with less than 10% of our employees
located in Germany, we actively encourage global mobility and offer
our employees the opportunity to go on international assignments. To
support relocating professionals and their families in new living and
working environments, we provide, for example, relevant language
and cultural training.
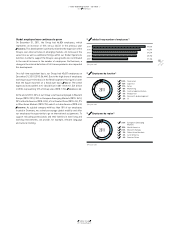
04 adidas Group number of employees 1)
2011 46,824
2010 42,541
2009 39,596
2008 38,982
2007 31,344
1) At year-end.
05 Employees by function 1)
1) At year-end.
2011
1 53% Own retail
2 12% Logistics
3 11% Sales
4 8% Marketing
5 8% Central administration
6 4% Production
7 2% Research & development
8 2% IT
1
2
3
4
5 6 7 8
06 Employees by region 1)
1) At year-end.
2011
1 33% European Emerging
Markets
2 25% North America
3 23% Western Europe
4 9% Other Asian Markets
5 6% Latin America
6 4% Greater China
1
2
3
6
4 5