Reebok 2011 Annual Report Download - page 160
Download and view the complete annual report
Please find page 160 of the 2011 Reebok annual report below. You can navigate through the pages in the report by either clicking on the pages listed below, or by using the keyword search tool below to find specific information within the annual report.-
 1
1 -
2
-
3
-
4
-
5
-
6
-
7
-
8
-
9
-
10
-
11
-
12
-
13
-
14
-
15
-
16
-
17
-
18
-
19
-
20
-
21
-
22
-
23
-
24
-
25
-
26
-
27
-
28
-
29
-
30
-
31
-
32
-
33
-
34
-
35
-
36
-
37
-
38
-
39
-
40
-
41
-
42
-
43
-
44
-
45
-
46
-
47
-
48
-
49
-
50
-
51
-
52
-
53
-
54
-
55
-
56
-
57
-
58
-
59
-
60
-
61
-
62
-
63
-
64
-
65
-
66
-
67
-
68
-
69
-
70
-
71
-
72
-
73
-
74
-
75
-
76
-
77
-
78
-
79
-
80
-
81
-
82
-
83
-
84
-
85
-
86
-
87
-
88
-
89
-
90
-
91
-
92
-
93
-
94
-
95
-
96
-
97
-
98
-
99
-
100
-
101
-
102
-
103
-
104
-
105
-
106
-
107
-
108
-
109
-
110
-
111
-
112
-
113
-
114
-
115
-
116
-
117
-
118
-
119
-
120
-
121
-
122
-
123
-
124
-
125
-
126
-
127
-
128
-
129
-
130
-
131
-
132
-
133
-
134
-
135
-
136
-
137
-
138
-
139
-
140
-
141
-
142
-
143
-
144
-
145
-
146
-
147
-
148
-
149
-
 150
150 -
 151
151 -
 152
152 -
 153
153 -
 154
154 -
 155
155 -
 156
156 -
 157
157 -
 158
158 -
 159
159 -
 160
160 -
 161
161 -
 162
162 -
 163
163 -
 164
164 -
 165
165 -
 166
166 -
 167
167 -
 168
168 -
 169
169 -
 170
170 -
171
-
172
-
173
-
174
-
175
-
176
-
177
-
178
-
179
-
180
-
181
-
182
-
183
-
184
-
185
-
186
-
187
-
188
-
189
-
190
-
191
-
192
-
193
-
194
-
195
-
196
-
197
-
198
-
199
-
200
-
201
-
202
-
203
-
204
-
205
-
206
-
207
-
208
-
209
-
210
-
211
-
212
-
213
-
214
-
215
-
216
-
217
-
218
-
219
-
220
-
221
-
222
-
223
-
224
-
225
-
226
-
227
-
228
-
229
-
230
-
231
-
232
-
233
-
234
-
235
-
236
-
237
-
238
-
239
-
240
-
241
-
242
 |
 |

adidas Group
2011 Annual Report
GROUP MANAGEMENT REPORT – FINANCIAL REVIEW
156
2011
03.4 Risk and Opportunity Report Financial risks
03.4
Currency risks
Currency risks for the adidas Group are a direct result of multi-
currency cash flows within the Group. Furthermore, translation
impacts from the conversion of non-euro-denominated results into
our Group’s functional currency, the euro, might lead to a material
negative impact on our Group’s financial performance. The biggest
single driver behind this risk results from the mismatch of the
currencies required for sourcing our products versus the denomina-
tions of our sales. The vast majority of our sourcing expenses are in
US dollars while sales are denominated in other currencies to a large
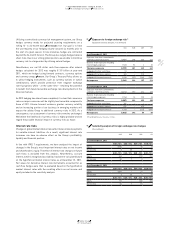
extent – most notably the euro. Our main exposures are presented
in the adjacent table
TABLE 05
. The exposure from firm commitments
and forecasted transactions was calculated on a one-year basis.
In line with IFRS 7 requirements, we have estimated the impact on
net income and shareholders’ equity based on changes in our most
important currency exchange rates. The calculated impacts mainly
result from fair value changes of our hedging instruments. The
analysis does not include effects that arise from the translation of
our foreign entities’ financial statements into the Group’s reporting
currency, the euro. The sensitivity analysis is based on the net balance
sheet exposure, including intercompany balances from monetary
assets and liabilities denominated in foreign currencies. Moreover, all
outstanding currency derivatives were re-evaluated using hypothetical
foreign exchange rates to determine the effects on net income and
equity. The analysis was performed on the same basis for both 2010
and 2011.
Based on this analysis, a 10% increase in the euro versus the US dollar
at December 31, 2011 would have led to a € 5 million increase in net
income. The more negative market values of the US dollar hedges
would have decreased shareholders’ equity by € 195 million. A 10%
weaker euro at December 31, 2011 would have led to a € 6 million
decrease in net income. Shareholders’ equity would have increased
by € 243 million
TABLE 06
. The impacts of fluctuations of the US dollar
against the Russian rouble and of the euro against the British pound
and the Japanese yen on net income and shareholders’ equity are also
included in accordance with IFRS requirements.
However, many other financial and operational variables that could
potentially reduce the effect of currency fluctuations are excluded
from the analysis. For instance:
− Interest rates, commodity prices and all other exchange rates are
assumed constant.
− Exchange rates are assumed at a year-end value instead of the more
relevant sales-weighted average figure, which we utilise internally
to better reflect both the seasonality of our business and intra-year
currency fluctuations.
− The underlying forecasted cash flow exposure (which the hedge
instrument mainly relates to) is not required to be revalued in this
analysis.
− Operational issues, such as potential discounts to key accounts,
which have high transparency regarding the impacts of currency
on our sourcing activities (due to their own private label sourcing
efforts), are also excluded from this presentation.
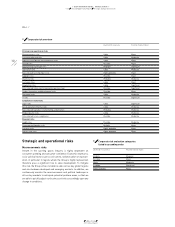
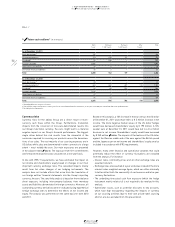
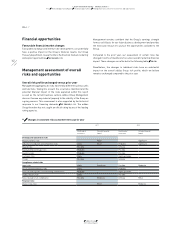
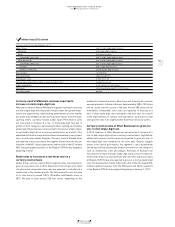
04 Future cash outflows 1) (€ in millions)
Up to
1 year
Between
1 and 3 years
Between
3 and 5 years
After
5 years
Total
As at December 31, 2011
Bank borrowings 2) 126 126
Private placements 3) 193 418 119 – 730
Eurobond 3) 24 538 – – 562
Accounts payable 1,886 – – – 1,886
Other financial liabilities 24 4 – – 28
Derivative financial liabilities 32 2 – – 34
Total 2,285 962 119 – 3,366
As at December 31, 2010
Bank borrowings 2) 95 – – – 95
Private placements 3) 320 482 237 118 1,157
Eurobond 3) 24 48 514 586
Accounts payable 1,694 – – – 1,694
Other financial liabilities 27 2 1 – 30
Derivative financial liabilities 96 12 – 108
Total 2,256 544 752 118 3,670
1) Rounding difference may arise in totals.
2) Classified as long-term (between 1 and 3 years) in the consolidated financial statements, as they are covered by the committed mid-term syndicated loan.
3) Including interest payments.