Reebok 2011 Annual Report Download - page 2
Download and view the complete annual report
Please find page 2 of the 2011 Reebok annual report below. You can navigate through the pages in the report by either clicking on the pages listed below, or by using the keyword search tool below to find specific information within the annual report.-
 1
1 -
 2
2 -
 3
3 -
 4
4 -
 5
5 -
 6
6 -
 7
7 -
 8
8 -
 9
9 -
 10
10 -
 11
11 -
 12
12 -
 13
13 -
 14
14 -
 15
15 -
 16
16 -
 17
17 -
 18
18 -
 19
19 -
 20
20 -
 21
21 -
 22
22 -
 23
23 -
 24
24 -
 25
25 -
 26
26 -
 27
27 -
 28
28 -
 29
29 -
 30
30 -
 31
31 -
 32
32 -
 33
33 -
 34
34 -
 35
35 -
 36
36 -
 37
37 -
 38
38 -
 39
39 -
 40
40 -
 41
41 -
 42
42 -
 43
43 -
 44
44 -
 45
45 -
 46
46 -
 47
47 -
 48
48 -
 49
49 -
 50
50 -
 51
51 -
 52
52 -
 53
53 -
 54
54 -
 55
55 -
 56
56 -
 57
57 -
 58
58 -
 59
59 -
 60
60 -
 61
61 -
 62
62 -
 63
63 -
 64
64 -
 65
65 -
 66
66 -
 67
67 -
 68
68 -
 69
69 -
 70
70 -
 71
71 -
 72
72 -
 73
73 -
 74
74 -
 75
75 -
 76
76 -
 77
77 -
 78
78 -
 79
79 -
 80
80 -
 81
81 -
 82
82 -
 83
83 -
 84
84 -
 85
85 -
 86
86 -
 87
87 -
 88
88 -
 89
89 -
 90
90 -
 91
91 -
 92
92 -
 93
93 -
 94
94 -
 95
95 -
 96
96 -
 97
97 -
 98
98 -
 99
99 -
 100
100 -
 101
101 -
 102
102 -
 103
103 -
 104
104 -
 105
105 -
 106
106 -
 107
107 -
 108
108 -
 109
109 -
 110
110 -
 111
111 -
 112
112 -
 113
113 -
 114
114 -
 115
115 -
 116
116 -
 117
117 -
 118
118 -
 119
119 -
 120
120 -
 121
121 -
 122
122 -
 123
123 -
 124
124 -
 125
125 -
 126
126 -
 127
127 -
 128
128 -
 129
129 -
 130
130 -
 131
131 -
 132
132 -
 133
133 -
 134
134 -
 135
135 -
 136
136 -
 137
137 -
 138
138 -
 139
139 -
 140
140 -
 141
141 -
 142
142 -
 143
143 -
 144
144 -
 145
145 -
 146
146 -
 147
147 -
 148
148 -
 149
149 -
 150
150 -
 151
151 -
 152
152 -
 153
153 -
 154
154 -
 155
155 -
 156
156 -
 157
157 -
 158
158 -
 159
159 -
 160
160 -
 161
161 -
 162
162 -
 163
163 -
 164
164 -
 165
165 -
 166
166 -
 167
167 -
 168
168 -
 169
169 -
 170
170 -
 171
171 -
 172
172 -
 173
173 -
 174
174 -
 175
175 -
 176
176 -
 177
177 -
 178
178 -
 179
179 -
 180
180 -
 181
181 -
 182
182 -
 183
183 -
 184
184 -
 185
185 -
 186
186 -
 187
187 -
 188
188 -
 189
189 -
 190
190 -
 191
191 -
 192
192 -
 193
193 -
 194
194 -
 195
195 -
 196
196 -
 197
197 -
 198
198 -
 199
199 -
 200
200 -
 201
201 -
 202
202 -
 203
203 -
 204
204 -
 205
205 -
 206
206 -
 207
207 -
 208
208 -
 209
209 -
 210
210 -
 211
211 -
 212
212 -
 213
213 -
 214
214 -
 215
215 -
 216
216 -
 217
217 -
 218
218 -
 219
219 -
 220
220 -
 221
221 -
 222
222 -
 223
223 -
 224
224 -
 225
225 -
 226
226 -
 227
227 -
 228
228 -
 229
229 -
 230
230 -
 231
231 -
 232
232 -
 233
233 -
 234
234 -
 235
235 -
 236
236 -
 237
237 -
 238
238 -
 239
239 -
 240
240 -
 241
241 -
 242
242
 |
 |

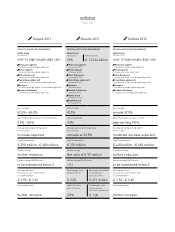
Targets 2011 Results 2011 Outlook 2012
Currency-neutral sales development:
adidas Group
increase at a
mid- to high-single-digit rate
Wholesale segment
increase at a mid-single-digit rate
Retail segment
increase at a low-double-digit rate
Other Businesses
increase at a mid-single-digit rate
TaylorMade-adidas Golf
increase at a low- to mid-single-digit rate
Rockport
increase at a high-single- to low-double-digit rate
Reebok-CCM Hockey
increase at a low-single-digit rate
Currency-neutral sales development:
adidas Group
increase of Group sales of
13% € 13.344 billion
Wholesale segment
increase of 11%
Retail segment
increase of 20%
Other Businesses
increase of 13%
TaylorMade-adidas Golf
increase of 16%
Rockport
increase of 6%
Reebok-CCM Hockey
increase of 6%
adidas brand
increase of 14%
Reebok brand
increase of 6%
Currency-neutral sales development:
adidas Group
increase at a
mid- to high-single-digit rate
Wholesale segment
increase at a mid-single-digit rate
Retail segment
increase at a low-teens rate
Other Businesses
increase at a low- to mid-single-digit rate
TaylorMade-adidas Golf
increase at a low- to mid-single-digit rate
Rockport
increase at a high-single-digit rate
Reebok-CCM Hockey
increase at a strong double-digit rate
Gross margin
47.5% – 48.0%
Gross margin
47.5%
Gross margin
around 47.5%
Operating margin increase to a level between
7.5% – 8.0%
Operating margin
7.6%
Operating margin increase to a level
approaching 8.0%
Average operating working capital
(in % of sales)
increase expected
Average operating working capital
(in % of sales)
remains at 20.8%
Average operating working capital
(in % of sales)
moderate increase expected
Capital expenditure
€ 350 million – € 400 million
Capital expenditure
€ 376 million
Capital expenditure
€ 400 million – € 450 million
Net borrowings
further reduction
Net borrowings
Net cash of € 90 million
Gross borrowings
further reduction
Net borrowings/EBITDA ratio
to be maintained below 2
Net borrowings/EBITDA ratio
– 0.1
Net borrowings/EBITDA ratio
to be maintained below 2
Earnings per share
increase at a rate of 10% to 15%
to a level between
€ 2.98 – € 3.12
Earnings per share
increase 18% to
€ 3.20
Net income attributable
to shareholders
increases 18% to
€ 671 million
Earnings per share
increase at a rate of 10% to 15%
to a level between
€ 3.52 – € 3.68
Shareholder value
further increase
adidas AG share
price increases
2.8%
Dividend per share
(subject to Annual
General Meeting approval)
€ 1.00
Shareholder value
further increase
