Reebok 2011 Annual Report Download - page 142
Download and view the complete annual report
Please find page 142 of the 2011 Reebok annual report below. You can navigate through the pages in the report by either clicking on the pages listed below, or by using the keyword search tool below to find specific information within the annual report.-
 1
1 -
2
-
3
-
4
-
5
-
6
-
7
-
8
-
9
-
10
-
11
-
12
-
13
-
14
-
15
-
16
-
17
-
18
-
19
-
20
-
21
-
22
-
23
-
24
-
25
-
26
-
27
-
28
-
29
-
30
-
31
-
32
-
33
-
34
-
35
-
36
-
37
-
38
-
39
-
40
-
41
-
42
-
43
-
44
-
45
-
46
-
47
-
48
-
49
-
50
-
51
-
52
-
53
-
54
-
55
-
56
-
57
-
58
-
59
-
60
-
61
-
62
-
63
-
64
-
65
-
66
-
67
-
68
-
69
-
70
-
71
-
72
-
73
-
74
-
75
-
76
-
77
-
78
-
79
-
80
-
81
-
82
-
83
-
84
-
85
-
86
-
87
-
88
-
89
-
90
-
91
-
92
-
93
-
94
-
95
-
96
-
97
-
98
-
99
-
100
-
101
-
102
-
103
-
104
-
105
-
106
-
107
-
108
-
109
-
110
-
111
-
112
-
113
-
114
-
115
-
116
-
117
-
118
-
119
-
120
-
121
-
122
-
123
-
124
-
125
-
126
-
127
-
128
-
129
-
130
-
131
-
 132
132 -
 133
133 -
 134
134 -
 135
135 -
 136
136 -
 137
137 -
 138
138 -
 139
139 -
 140
140 -
 141
141 -
 142
142 -
 143
143 -
 144
144 -
 145
145 -
 146
146 -
 147
147 -
 148
148 -
 149
149 -
 150
150 -
 151
151 -
 152
152 -
153
-
154
-
155
-
156
-
157
-
158
-
159
-
160
-
161
-
162
-
163
-
164
-
165
-
166
-
167
-
168
-
169
-
170
-
171
-
172
-
173
-
174
-
175
-
176
-
177
-
178
-
179
-
180
-
181
-
182
-
183
-
184
-
185
-
186
-
187
-
188
-
189
-
190
-
191
-
192
-
193
-
194
-
195
-
196
-
197
-
198
-
199
-
200
-
201
-
202
-
203
-
204
-
205
-
206
-
207
-
208
-
209
-
210
-
211
-
212
-
213
-
214
-
215
-
216
-
217
-
218
-
219
-
220
-
221
-
222
-
223
-
224
-
225
-
226
-
227
-
228
-
229
-
230
-
231
-
232
-
233
-
234
-
235
-
236
-
237
-
238
-
239
-
240
-
241
-
242
 |
 |

adidas Group
2011 Annual Report
GROUP MANAGEMENT REPORT – FINANCIAL REVIEW
138
2011
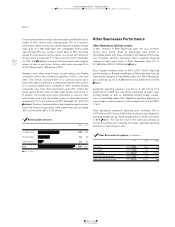
03.3 Business Performance by Segment Wholesale Business Performance
03.3
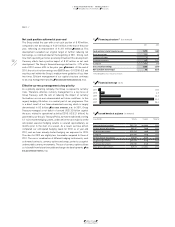
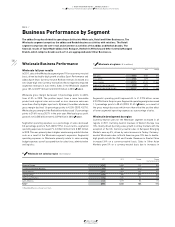
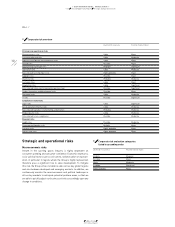
01 Wholesale at a glance (€ in millions)
2011 2010 Change
Net sales 8,971 8,181 10%
Gross profit 3,585 3,379 6%
Gross margin 40.0% 41.3% (1.3pp)
Segmental operating profit 2,725 2,572 6%
Segmental operating margin 30.4% 31.4% (1.1pp)
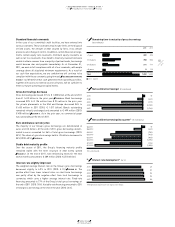
02 Wholesale net sales by region (€ in millions)
2011 2010 Change Change
(currency-neutral)
Western Europe 3,187 2,882 11% 10%
European Emerging Markets 496 503 (1%) 5%
North America 1,771 1,609 10% 15%
Greater China 1,038 840 23% 24%
Other Asian Markets 1,354 1,270 7% 5%
Latin America 1,125 1,077 5% 8%
Total 1) 8,971 8,181 10% 11%
1) Rounding differences may arise in totals.
Business Performance by Segment
The adidas Group has divided its operating activities into Wholesale, Retail and Other Businesses. The
Wholesale segment comprises the adidas and Reebok business activities with retailers. The Retail
segment comprises the own-retail and eCommerce activities of the adidas and Reebok brands. The
financial results of TaylorMade-adidas Golf, Rockport, Reebok-CCM Hockey and Other Centrally Managed
Brands, which comprise brands such as Y-3, are aggregated under Other Businesses.
Segmental operating profit improved 6% to € 2.725 billion versus
€ 2.572 billion in the prior year. Segmental operating margin decreased
1.1 percentage points to 30.4% (2010: 31.4%)
TABLE 01
, as a result of
the gross margin decrease which more than offset the positive effect
of lower segmental operating expenses as a percentage of sales.
Wholesale development by region
Currency-neutral sales for the Wholesale segment increased in all
regions in 2011. Currency-neutral revenues in Western Europe rose
10%, mainly driven by strong sales growth in all key markets with the
exception of the UK. Currency-neutral sales in European Emerging
Markets were up 5%, driven by sales increases in Turkey. Currency-
neutral Wholesale sales in North America grew 15% due to double-
digit growth in both the USA and Canada. Revenues in Greater China
increased 24% on a currency-neutral basis. Sales in Other Asian
Markets grew 5% on a currency-neutral basis due to increases in
Wholesale Business Performance
Wholesale full year results
In 2011, sales in the Wholesale segment grew 11% on a currency-neutral
basis, driven by double-digit growth at adidas Sport Performance and
adidas Sport Style. Currency-neutral Reebok revenues increased at a
low-single-digit rate. Currency translation effects negatively impacted
segmental revenues in euro terms. Sales in the Wholesale segment
grew 10% to € 8.971 billion from € 8.181 billion in 2010
TABLE 01
.
Wholesale gross margin decreased 1.3 percentage points to 40.0%
from 41.3% in 2010. The positive impact from a more favourable
product and regional sales mix as well as less clearance sales was
more than offset by higher input costs. By brand, the adidas wholesale
gross margin declined 1.6 percentage points to 42.0% (2010: 43.7%).
Wholesale gross margin of the Reebok brand decreased 1.1 percentage
points to 29.6% versus 30.7% in the prior year. Wholesale gross profit
grew 6% to € 3.585 billion from € 3.379 billion in 2010
TABLE 01
.
Segmental operating expenses as a percentage of sales decreased
0.3 percentage points to 9.6% (2010: 9.9%). In euro terms, segmental
operating expenses increased 7% to € 861 million from € 807 million
in 2010. This was primarily due to higher warehousing and distribution
costs as a result of the Wholesale segment’s expansion. Segmental
operating expenses in Wholesale primarily relate to sales working
budget expenses as well as expenditure for sales force, administration
and logistics.