Reebok 2011 Annual Report Download - page 212
Download and view the complete annual report
Please find page 212 of the 2011 Reebok annual report below. You can navigate through the pages in the report by either clicking on the pages listed below, or by using the keyword search tool below to find specific information within the annual report.-
 1
1 -
2
-
3
-
4
-
5
-
6
-
7
-
8
-
9
-
10
-
11
-
12
-
13
-
14
-
15
-
16
-
17
-
18
-
19
-
20
-
21
-
22
-
23
-
24
-
25
-
26
-
27
-
28
-
29
-
30
-
31
-
32
-
33
-
34
-
35
-
36
-
37
-
38
-
39
-
40
-
41
-
42
-
43
-
44
-
45
-
46
-
47
-
48
-
49
-
50
-
51
-
52
-
53
-
54
-
55
-
56
-
57
-
58
-
59
-
60
-
61
-
62
-
63
-
64
-
65
-
66
-
67
-
68
-
69
-
70
-
71
-
72
-
73
-
74
-
75
-
76
-
77
-
78
-
79
-
80
-
81
-
82
-
83
-
84
-
85
-
86
-
87
-
88
-
89
-
90
-
91
-
92
-
93
-
94
-
95
-
96
-
97
-
98
-
99
-
100
-
101
-
102
-
103
-
104
-
105
-
106
-
107
-
108
-
109
-
110
-
111
-
112
-
113
-
114
-
115
-
116
-
117
-
118
-
119
-
120
-
121
-
122
-
123
-
124
-
125
-
126
-
127
-
128
-
129
-
130
-
131
-
132
-
133
-
134
-
135
-
136
-
137
-
138
-
139
-
140
-
141
-
142
-
143
-
144
-
145
-
146
-
147
-
148
-
149
-
150
-
151
-
152
-
153
-
154
-
155
-
156
-
157
-
158
-
159
-
160
-
161
-
162
-
163
-
164
-
165
-
166
-
167
-
168
-
169
-
170
-
171
-
172
-
173
-
174
-
175
-
176
-
177
-
178
-
179
-
180
-
181
-
182
-
183
-
184
-
185
-
186
-
187
-
188
-
189
-
190
-
191
-
192
-
193
-
194
-
195
-
196
-
197
-
198
-
199
-
200
-
201
-
 202
202 -
 203
203 -
 204
204 -
 205
205 -
 206
206 -
 207
207 -
 208
208 -
 209
209 -
 210
210 -
 211
211 -
 212
212 -
 213
213 -
 214
214 -
 215
215 -
 216
216 -
 217
217 -
 218
218 -
 219
219 -
 220
220 -
 221
221 -
 222
222 -
223
-
224
-
225
-
226
-
227
-
228
-
229
-
230
-
231
-
232
-
233
-
234
-
235
-
236
-
237
-
238
-
239
-
240
-
241
-
242
 |
 |
adidas Group
2011 Annual Report
CONSOLIDATED FINANCIAL STATEMENTS
208
2011
208
2011
04.8
04.8 Notes Notes to the Consolidated Statement of Financial Position Notes to the Consolidated Income Statement
In order to determine the fair values of its derivatives that are not
publicly traded, the adidas Group uses generally accepted quantitative
financial models based on market conditions prevailing at the balance
sheet date.
In 2011, the fair values of the derivatives were determined applying
the “par method”, which uses actively traded forward rates. In 2010,
the “zero method” was applied, which is a theoretical model for the
determination of forward rates based on deposit and swap interest
rates.
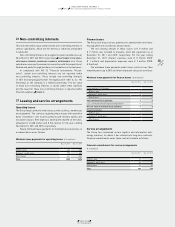
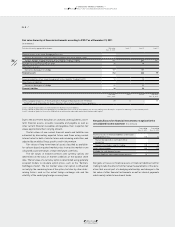
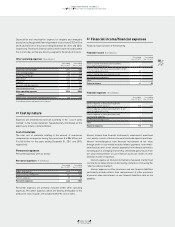
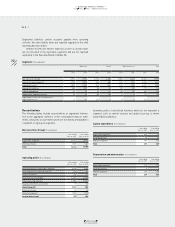
Financial instruments for the hedging of interest
rate risk
Interest rate hedges which were outstanding as at December 31, 2011
and 2010, respectively expire as detailed below:
Expiration dates of interest rate hedges (€ in millions)
Dec. 31, 2011 Dec. 31, 2010
Within 1 year 105 60
Between 1 and 3 years – 105
Between 3 and 5 years – 75
After 5 years – –
Total 105 240
The above-mentioned interest rate swaps in the nominal amount of
€ 105 million (2010: € 150 million) are classified as cash flow hedges
pursuant to IAS 39. The goal of these hedges is to protect future cash
flows arising from private placements with variable interest rates by
generating synthetic fixed interest rate financing. These interest rate
swaps classified as cash flow hedges had a positive fair value in the
amount of € 0 million (2010: € 0 million) and a negative fair value of
€ 4 million (2010: negative € 6 million). The negative fair value change
of € 0 million (2010: negative € 2 million) for interest rate swaps which
were classified as cash flow hedges was booked in hedging reserves.
The amount that was reclassified from equity to the income statement
for the period was negative € 3 million (2010: negative € 4 million).
Interest rate swaps classified as cash flow hedges in a nominal
amount of € 105 million secure variable interest payments arising
from private placements with maturities in 2012.
The above summary for 2010 includes an interest rate swap in
the amount of € 75 million which is classified as a fair value hedge
pursuant to IAS 39. The aim of this US dollar interest rate swap was to
obtain variable financing for a private placement in US dollars. The US
dollar interest rate swap was closed in 2011 and the resulting income
in the amount of € 7 million is amortised to the income statement over
the maturity of the private placement.
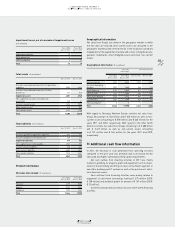
Notes to the Consolidated
Income Statement
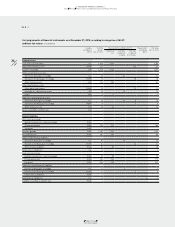
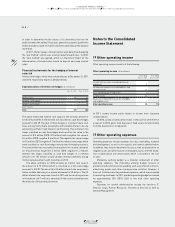
29 Other operating income
Other operating income consists of the following:
Other operating income (€ in millions)
Year ending
Dec. 31, 2011
Year ending
Dec. 31, 2010
Income from accounts receivable previously
written off 4 2
Income from release of accrued liabilities and
other provisions 27 19
Gains from disposal of fixed assets 0 16
Sundry income 66 66
Reversals of impairment losses for intangible
and tangible assets 1 7
Other operating income 98 110
In 2011, sundry income partly relates to income from insurance
compensations.
In 2010, sundry income partly relates to the positive settlement of
a lawsuit. In 2010, gains from disposal of fixed assets include income
from the divestiture of a trademark.
30 Other operating expenses
Operating expenses include expenses for sales, marketing, research
and development, as well as for logistics and central administration.
In addition, they include impairment losses as well as depreciation on
tangible assets and amortisation on intangible assets, with the excep-
tion of depreciation and amortisation which is included in the cost
of sales.
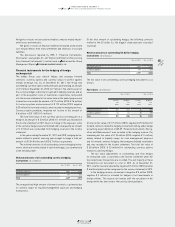
Marketing working budget is a material component of other
operating expenses. The marketing working budget consists of
promotion and communication spending such as promotion contracts,
advertising, events and other communication activities. However, it
does not include marketing overhead expenses, which are presented
in marketing overheads. In 2011, marketing working budget accounted
for approximately 25% (2010: 26%) of the total other operating
expenses.
Expenses for central administration include the functions IT,
Finance, Legal, Human Resources, Facilities & Services as well as
General Management.