Reebok 2011 Annual Report Download - page 125
Download and view the complete annual report
Please find page 125 of the 2011 Reebok annual report below. You can navigate through the pages in the report by either clicking on the pages listed below, or by using the keyword search tool below to find specific information within the annual report.-
 1
1 -
2
-
3
-
4
-
5
-
6
-
7
-
8
-
9
-
10
-
11
-
12
-
13
-
14
-
15
-
16
-
17
-
18
-
19
-
20
-
21
-
22
-
23
-
24
-
25
-
26
-
27
-
28
-
29
-
30
-
31
-
32
-
33
-
34
-
35
-
36
-
37
-
38
-
39
-
40
-
41
-
42
-
43
-
44
-
45
-
46
-
47
-
48
-
49
-
50
-
51
-
52
-
53
-
54
-
55
-
56
-
57
-
58
-
59
-
60
-
61
-
62
-
63
-
64
-
65
-
66
-
67
-
68
-
69
-
70
-
71
-
72
-
73
-
74
-
75
-
76
-
77
-
78
-
79
-
80
-
81
-
82
-
83
-
84
-
85
-
86
-
87
-
88
-
89
-
90
-
91
-
92
-
93
-
94
-
95
-
96
-
97
-
98
-
99
-
100
-
101
-
102
-
103
-
104
-
105
-
106
-
107
-
108
-
109
-
110
-
111
-
112
-
113
-
114
-
 115
115 -
 116
116 -
 117
117 -
 118
118 -
 119
119 -
 120
120 -
 121
121 -
 122
122 -
 123
123 -
 124
124 -
 125
125 -
 126
126 -
 127
127 -
 128
128 -
 129
129 -
 130
130 -
 131
131 -
 132
132 -
 133
133 -
 134
134 -
 135
135 -
136
-
137
-
138
-
139
-
140
-
141
-
142
-
143
-
144
-
145
-
146
-
147
-
148
-
149
-
150
-
151
-
152
-
153
-
154
-
155
-
156
-
157
-
158
-
159
-
160
-
161
-
162
-
163
-
164
-
165
-
166
-
167
-
168
-
169
-
170
-
171
-
172
-
173
-
174
-
175
-
176
-
177
-
178
-
179
-
180
-
181
-
182
-
183
-
184
-
185
-
186
-
187
-
188
-
189
-
190
-
191
-
192
-
193
-
194
-
195
-
196
-
197
-
198
-
199
-
200
-
201
-
202
-
203
-
204
-
205
-
206
-
207
-
208
-
209
-
210
-
211
-
212
-
213
-
214
-
215
-
216
-
217
-
218
-
219
-
220
-
221
-
222
-
223
-
224
-
225
-
226
-
227
-
228
-
229
-
230
-
231
-
232
-
233
-
234
-
235
-
236
-
237
-
238
-
239
-
240
-
241
-
242
 |
 |

adidas Group
2011 Annual Report
GROUP MANAGEMENT REPORT – FINANCIAL REVIEW
121
2011
Retail sales rose 17% to € 2.793 billion versus € 2.389 billion in the
prior year. Sales in Other Businesses grew 11% to € 1.580 billion
(2010: € 1.420 billion).
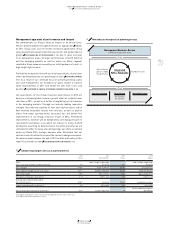
Currency-neutral sales increase in all regions
In 2011, revenues in Western Europe increased 10% on a currency-
neutral basis, primarily as a result of strong sales growth in Germany,
France, Spain and Italy. In European Emerging Markets, Group sales
increased 22% on a currency-neutral basis due to growth in most
of the region’s markets, in particular Russia. Sales for the adidas
Group in North America grew 15% on a currency-neutral basis due
to double-digit sales increases in both the USA and Canada. Sales in
Greater China increased 23% on a currency-neutral basis. Currency-
neutral revenues in Other Asian Markets grew 5% due to increases in
most markets, in particular South Korea. In Latin America, sales grew
10% on a currency-neutral basis, with strong double-digit increases in
most of the region’s major markets. Currency translation effects had a
mixed impact on regional sales in euro terms
TABLE 09
.
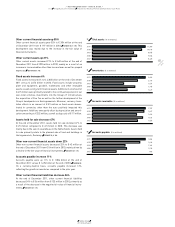
03.2 Group Business Performance Income Statement
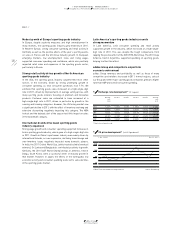
07 Net sales (€ in millions)
2011 13,344
2010 11,990
2009 10,381
2008 10,799
2007 10,299
08 Net sales by quarter (€ in millions)
Q4 2011 3,263
Q4 2010 2,931
Q3 2011 3,744
Q3 2010 3,468
Q2 2011 3,064
Q2 2010 2,917
Q1 2011 3,273
Q1 2010 2,674
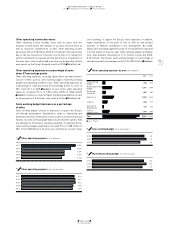
11 Net sales by segment
2011 1 67% Wholesale
2 21% Retail
3 12% Other Businesses
1
2
3
10 Net sales by region
2011
1 30% Western Europe
2 23% North America
3 16% Other Asian Markets
4 12% European Emerging Markets
5 10% Latin America
6 9% Greater China
6
5 1
2
3
4
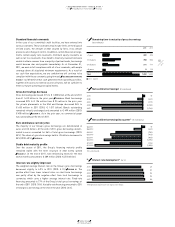
09 Net sales by region (€ in millions)
2011 2010 Change Change
(currency-neutral)
Western Europe 3,922 3,543 11% 10%
European Emerging Markets 1,597 1,385 15% 22%
North America 3,102 2,805 11% 15%
Greater China 1,229 1,000 23% 23%
Other Asian Markets 2,125 1,972 8% 5%
Latin America 1,369 1,285 7% 10%
Total 1) 13,344 11,990 11% 13%
1) Rounding differences may arise in totals.
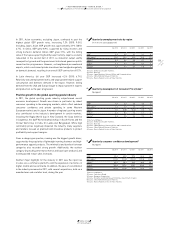
Income Statement
adidas Group currency-neutral sales grow 13%
In 2011, Group revenues grew 13% on a currency-neutral basis, as a
result of double-digit sales increases in Wholesale, Retail and Other
Businesses. This development exceeded initial Management expect-
ations of a mid- to high-single-digit Group sales increase. Currency
translation effects had a negative impact on sales in euro terms. Group
revenues grew 11% to € 13.344 billion in 2011 from € 11.990 billion in
2010
DIAGRAM 07
.
Group sales increase driven by double-digit growth
in all segments
In 2011, currency-neutral Wholesale revenues increased 11%, mainly
due to double-digit sales growth at adidas. Currency-neutral Retail
sales increased 20% versus the prior year, as a result of double-digit
comparable store sales growth. Revenues in Other Businesses were up
13% on a currency-neutral basis, mainly driven by double-digit sales
increases at TaylorMade-adidas Golf. Currency translation effects
had a negative impact on segmental sales in euro terms. Wholesale
revenues increased 10% to € 8.971 billion from € 8.181 billion in 2010.