Reebok 2011 Annual Report Download - page 215
Download and view the complete annual report
Please find page 215 of the 2011 Reebok annual report below. You can navigate through the pages in the report by either clicking on the pages listed below, or by using the keyword search tool below to find specific information within the annual report.-
 1
1 -
2
-
3
-
4
-
5
-
6
-
7
-
8
-
9
-
10
-
11
-
12
-
13
-
14
-
15
-
16
-
17
-
18
-
19
-
20
-
21
-
22
-
23
-
24
-
25
-
26
-
27
-
28
-
29
-
30
-
31
-
32
-
33
-
34
-
35
-
36
-
37
-
38
-
39
-
40
-
41
-
42
-
43
-
44
-
45
-
46
-
47
-
48
-
49
-
50
-
51
-
52
-
53
-
54
-
55
-
56
-
57
-
58
-
59
-
60
-
61
-
62
-
63
-
64
-
65
-
66
-
67
-
68
-
69
-
70
-
71
-
72
-
73
-
74
-
75
-
76
-
77
-
78
-
79
-
80
-
81
-
82
-
83
-
84
-
85
-
86
-
87
-
88
-
89
-
90
-
91
-
92
-
93
-
94
-
95
-
96
-
97
-
98
-
99
-
100
-
101
-
102
-
103
-
104
-
105
-
106
-
107
-
108
-
109
-
110
-
111
-
112
-
113
-
114
-
115
-
116
-
117
-
118
-
119
-
120
-
121
-
122
-
123
-
124
-
125
-
126
-
127
-
128
-
129
-
130
-
131
-
132
-
133
-
134
-
135
-
136
-
137
-
138
-
139
-
140
-
141
-
142
-
143
-
144
-
145
-
146
-
147
-
148
-
149
-
150
-
151
-
152
-
153
-
154
-
155
-
156
-
157
-
158
-
159
-
160
-
161
-
162
-
163
-
164
-
165
-
166
-
167
-
168
-
169
-
170
-
171
-
172
-
173
-
174
-
175
-
176
-
177
-
178
-
179
-
180
-
181
-
182
-
183
-
184
-
185
-
186
-
187
-
188
-
189
-
190
-
191
-
192
-
193
-
194
-
195
-
196
-
197
-
198
-
199
-
200
-
201
-
202
-
203
-
204
-
 205
205 -
 206
206 -
 207
207 -
 208
208 -
 209
209 -
 210
210 -
 211
211 -
 212
212 -
 213
213 -
 214
214 -
 215
215 -
 216
216 -
 217
217 -
 218
218 -
 219
219 -
 220
220 -
 221
221 -
 222
222 -
 223
223 -
 224
224 -
 225
225 -
226
-
227
-
228
-
229
-
230
-
231
-
232
-
233
-
234
-
235
-
236
-
237
-
238
-
239
-
240
-
241
-
242
 |
 |

adidas Group
2011 Annual Report
CONSOLIDATED FINANCIAL STATEMENTS
211
2011
211
2011
04.8 Notes Notes to the Consolidated Income Statement Notes – Additional Information
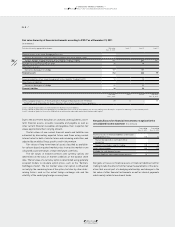
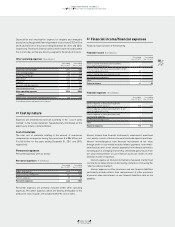
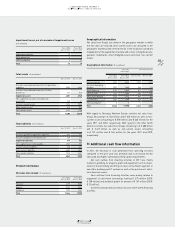
The effective tax rate of the Group differs from an assumed tax rate of
30% for the year ending December 31, 2011 as follows:
Tax rate reconciliation
Year ending Dec. 31, 2011 Year ending Dec. 31, 2010
€ in millions in % € in millions in %
Expected income tax
expenses 278 30.0 242 30.0
Tax rate differentials (81) (8.8) (89) (11.0)
Non-deductible expenses 5 0.6 43 5.3
Losses for which benefits
were not recognisable
and changes in valuation
allowances 1 0.1 8 1.0
Changes in tax rates (8) (0.9) (11) (1.4)
Other, net 1 0.1 1 0.1
196 21.1 194 24.0
Withholding tax expenses 61 6.6 44 5.5
Income tax expenses 257 27.7 238 29.5
For 2011 and 2010, the line “changes in tax rates” mainly reflects a UK
tax rate deduction effective in 2012 and 2011.
For 2011, the line “non-deductible expenses” includes tax benefits
of in total € 26 million (2010: € 14 million) related to the favourable
resolution of foreign tax disputes for prior years.
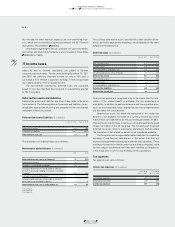
34 Earnings per share
Basic earnings per share are calculated by dividing the net income
attributable to shareholders by the weighted average number of
shares outstanding during the year.
For 2011 and 2010, no dilutive effects occurred.
Earnings per share
Year ending
Dec. 31, 2011
Year ending
Dec. 31, 2010
Net income attributable to shareholders
(€ in millions) 671 567
Weighted average number of shares 209,216,186 209,216,186
Basic earnings per share (in €) 3.20 2.71
Notes – Additional Information
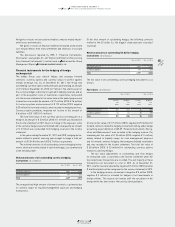
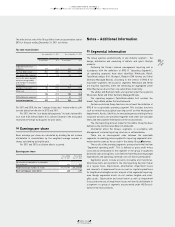
35 Segmental information
The Group operates predominantly in one industry segment – the
design, distribution and marketing of athletic and sports lifestyle
products.
Following the Group’s internal management reporting and in
accordance with the definition of IFRS 8 “Operating Segments”,
six operating segments have been identified: Wholesale, Retail,
TaylorMade-adidas Golf, Rockport, Reebok-CCM Hockey and Other
Centrally Managed Brands. According to the criteria of IFRS 8 for
reportable segments, the business segments Wholesale and Retail
are reported separately, while the remaining are aggregated under
Other Businesses due to their only subordinate materiality.
The adidas and Reebok brands are reported under the segments
Wholesale, Retail and Other Centrally Managed Brands.
The operating segment TaylorMade-adidas Golf contains the
brands TaylorMade, adidas Golf and Ashworth.
Certain centralised Group functions do not meet the definition of
IFRS 8 for a reportable operating segment. This includes functions
such as central treasury, global sourcing as well as other headquarter
departments. Assets, liabilities, income and expenses relating to these
corporate functions are presented together with other non-allocable
items and intersegment eliminations in the reconciliations.
The chief operating decision maker for the adidas Group has been
defined as the joint Executive Board of adidas AG.
Information about the Group’s segments, in accordance with
Management’s internal reporting structure, is outlined below.
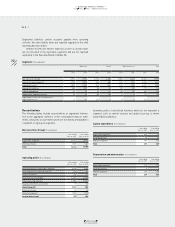
There are no intersegment sales between the reportable
segments. Accounting policies applied for reporting segmental infor-
mation are the same as those used for the adidas Group
SEE NOTE 02
.
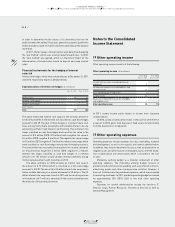
The results of the operating segments are reported in the line item
”Segmental operating profit”. This is defined as gross profit minus
costs directly attributable to the segment or the group of segments
(primarily sales and logistics costs) before marketing working budget
expenditures and operating overhead costs not directly attributable.
Segmental assets include accounts receivable and inventories.
Only these items are reported to the chief operating decision maker
on a regular basis. Depreciation, amortisation, impairment losses
and reversals of impairment losses as well as capital expenditures
for tangible and intangible assets are part of the segmental reporting,
even though segmental assets do not contain tangible and intan-
gible assets. Depreciation and amortisation as well as impairment
losses and reversals of impairment losses not directly attributable to
a segment or a group of segments are presented under HQ/Consoli-
dation in the reconciliations.