Reebok 2011 Annual Report Download - page 131
Download and view the complete annual report
Please find page 131 of the 2011 Reebok annual report below. You can navigate through the pages in the report by either clicking on the pages listed below, or by using the keyword search tool below to find specific information within the annual report.-
 1
1 -
2
-
3
-
4
-
5
-
6
-
7
-
8
-
9
-
10
-
11
-
12
-
13
-
14
-
15
-
16
-
17
-
18
-
19
-
20
-
21
-
22
-
23
-
24
-
25
-
26
-
27
-
28
-
29
-
30
-
31
-
32
-
33
-
34
-
35
-
36
-
37
-
38
-
39
-
40
-
41
-
42
-
43
-
44
-
45
-
46
-
47
-
48
-
49
-
50
-
51
-
52
-
53
-
54
-
55
-
56
-
57
-
58
-
59
-
60
-
61
-
62
-
63
-
64
-
65
-
66
-
67
-
68
-
69
-
70
-
71
-
72
-
73
-
74
-
75
-
76
-
77
-
78
-
79
-
80
-
81
-
82
-
83
-
84
-
85
-
86
-
87
-
88
-
89
-
90
-
91
-
92
-
93
-
94
-
95
-
96
-
97
-
98
-
99
-
100
-
101
-
102
-
103
-
104
-
105
-
106
-
107
-
108
-
109
-
110
-
111
-
112
-
113
-
114
-
115
-
116
-
117
-
118
-
119
-
120
-
 121
121 -
 122
122 -
 123
123 -
 124
124 -
 125
125 -
 126
126 -
 127
127 -
 128
128 -
 129
129 -
 130
130 -
 131
131 -
 132
132 -
 133
133 -
 134
134 -
 135
135 -
 136
136 -
 137
137 -
 138
138 -
 139
139 -
 140
140 -
 141
141 -
142
-
143
-
144
-
145
-
146
-
147
-
148
-
149
-
150
-
151
-
152
-
153
-
154
-
155
-
156
-
157
-
158
-
159
-
160
-
161
-
162
-
163
-
164
-
165
-
166
-
167
-
168
-
169
-
170
-
171
-
172
-
173
-
174
-
175
-
176
-
177
-
178
-
179
-
180
-
181
-
182
-
183
-
184
-
185
-
186
-
187
-
188
-
189
-
190
-
191
-
192
-
193
-
194
-
195
-
196
-
197
-
198
-
199
-
200
-
201
-
202
-
203
-
204
-
205
-
206
-
207
-
208
-
209
-
210
-
211
-
212
-
213
-
214
-
215
-
216
-
217
-
218
-
219
-
220
-
221
-
222
-
223
-
224
-
225
-
226
-
227
-
228
-
229
-
230
-
231
-
232
-
233
-
234
-
235
-
236
-
237
-
238
-
239
-
240
-
241
-
242
 |
 |
adidas Group
2011 Annual Report
GROUP MANAGEMENT REPORT – FINANCIAL REVIEW
127
2011
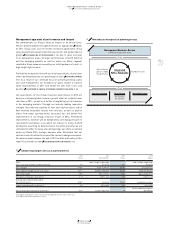
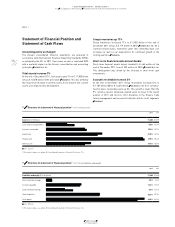
03.2 Group Business Performance Statement of Financial Position and Statement of Cash Flows
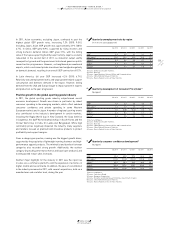
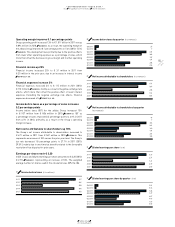
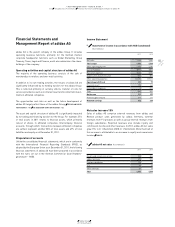
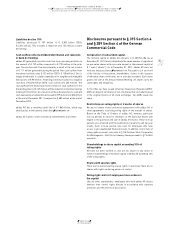
35 Total assets (€ in millions)
2011 11,380
2010 10,618
2009 8,875
2008 9,533
2007 8,325
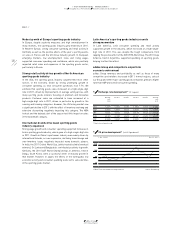
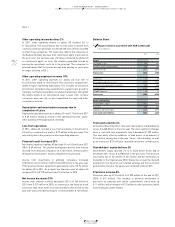
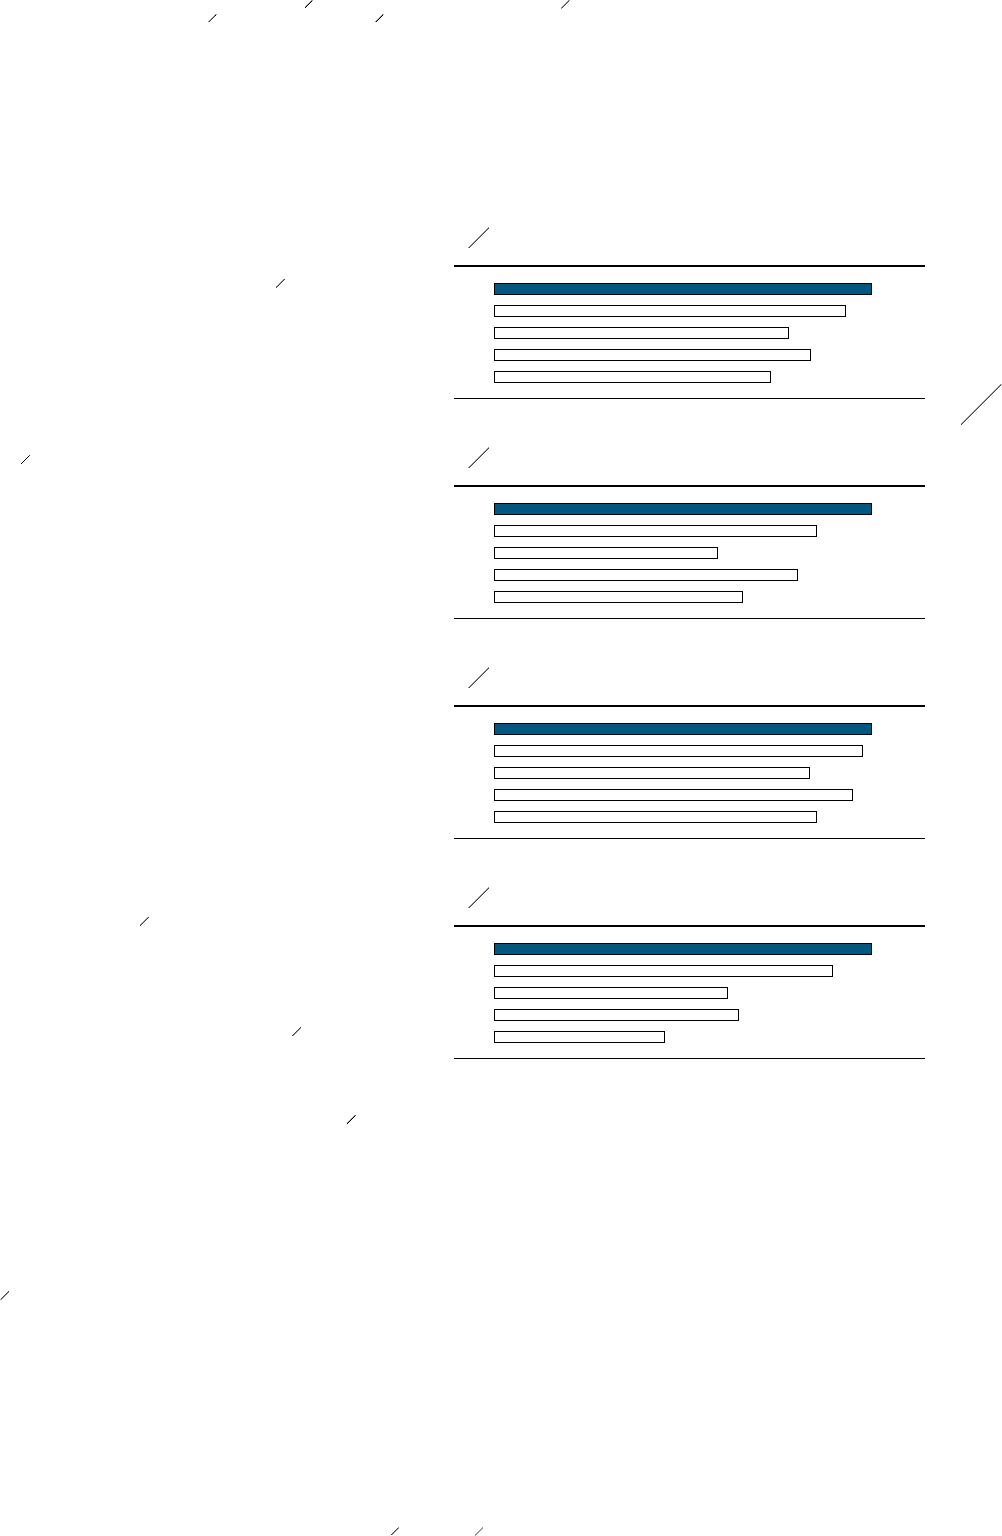
37 Accounts receivable (€ in millions)
2011 1,707
2010 1,667
2009 1,429
2008 1,624
2007 1,459
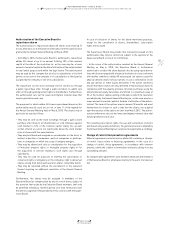
36 Inventories (€ in millions)
2011 2,482
2010 2,119
2009 1,471
2008 1,995
2007 1,629
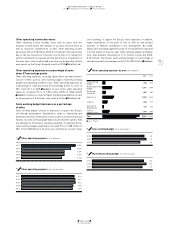
38 Accounts payable (€ in millions)
2011 1,886
2010 1,694
2009 1,166
2008 1,218
2007 849
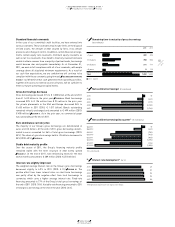
Other current financial assets up 55%
Other current financial assets grew 55% to € 304 million at the end
of December 2011 from € 197 million in 2010
SEE NOTE 07, P. 189
. This
develop ment was mainly due to the increase in the fair value of
financial instruments.
Other current assets up 21%
Other current assets increased 21% to € 469 million at the end of
December 2011 from € 390 million in 2010, mainly as a result of an
increase in tax receivables other than income taxes as well as prepaid
expenses
SEE NOTE 09, P. 190
.
Fixed assets increase 6%
Fixed assets increased 6% to € 4.303 billion at the end of December
2011 versus € 4.076 billion in 2010. Fixed assets include property,
plant and equipment, goodwill, trademarks and other intangible
assets as well as long-term financial assets. Additions in an amount of
€ 415 million were primarily related to the continued expansion of our
own-retail activities, investments into the Group’s IT infrastructure,
the acquisition of Five Ten as well as the further development of the
Group’s headquarters in Herzogenaurach. Moreover, currency trans-
lation effects in an amount of € 81 million on fixed assets denom-
inated in currencies other than the euro positively impacted this
develop ment. Additions were partly offset by depreciation and amorti-
sation amounting to € 252 million, as well as disposals of € 17 million.
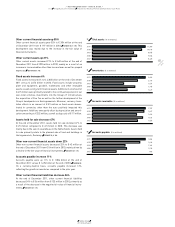
Assets held for sale decrease 47%
At the end of December 2011, assets held for sale declined 47% to
€ 25 million compared to € 47 million in 2010. This decrease was
mainly due to the sale of a warehouse in the Netherlands. Assets held
for sale primarily relate to the planned sale of land and buildings in
Herzogenaurach, Germany
SEE NOTE 10, P. 190
.
Other non-current financial assets down 22%
Other non-current financial assets decreased 22% to € 42 million at
the end of December 2011 from € 54 million in 2010, mainly driven by
a decline in the fair value of financial instruments
SEE NOTE 15, P. 192
.
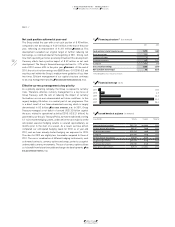
Accounts payable increase 11%
Accounts payable were up 11% to € 1.886 billion at the end of
December 2011 versus € 1.694 billion at the end of 2010
DIAGRAM 38
.
On a currency-neutral basis, accounts payable increased 12%,
reflecting the growth in inventories compared to the prior year.
Other current financial liabilities decrease 54%
At the end of December 2011, other current financial liabilities
decreased 54% to € 56 million from € 123 million in 2010, primarily as
a result of the decrease in the negative fair value of financial instru-
ments
SEE NOTE 18, P. 193
.